
Now that we've connected the dots between the CDS (Credit Default Swap) spreads on government-issued bonds and the probability that the government will default on that debt in the near future, how does that risk tie into the yields on the bonds?
It's not like bond investors are clueless in the situation where a government might not make good on its debt. Although Credit Default Swaps have only become well known since the 1990s, bond investors have had to be on the watch for potentially deadbeat governments for centuries.
So they've come to do what lenders do when they make deals with people who have a higher probability of running out on their obligations. They charge them higher interest rates. And the more likely the borrower might run out on them, the higher the interest rate they charge.
The same is true for governments. The chart below shows what we found when we matched the 10-Year government bond rate for a number of nations with the 5-Year CDS mid-spread values, both of which we recorded during the period from 20 through 24 May 2011:
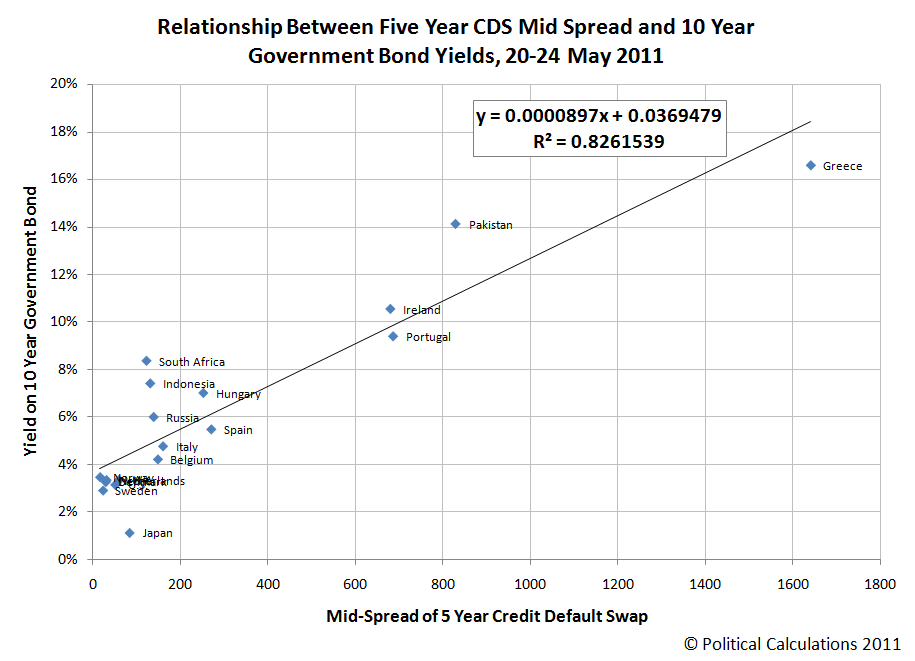
Now, here's where it gets interesting! The key part of the linear equation we found is the slope (the value multiplied by x). If we invert the slope, we find that a 90-110 point rise in the CDS spread generally corresponds to a 1% increase in the amount of the interest rate that governments must provide to investors as a condition of being able to borrow the money.
Or in other words, if a country sees its CDS spread rise by 90-110 points, which likely corresponds to an increase the probability that it will default on its debt, we should see the interest rates on the 10-year bonds it issues go up by roughly 1%, as investors seek to secure greater returns before the default might take place. Likewise, if a country's CDS spread falls by 90-100 points, the yield on its bonds should go down by roughly 1%.
The effective default risk free rate can be read directly as the value of the y-intercept. For this selection of nations, it's roughly 3.7%.
The risk of default however is not the only factor that interest rates take into account. There's also the risk of rising inflation over the period for which the government is issuing debt. In the chart above, we can identify those nations where inflation is significant by seeing how far above the line they are (in the case of South Africa, Pakistan and Indonesia, while governments far below the line are more likely at risk of deflation, such as Japan has been for an extended period of time.
Given that inflation is more prevalent than deflation in the world, we can't say the same thing for nations that are just below the line, as the linear regression itself would be shifted upward over what would be the case for a non-inflationary world.
As a result, we would instead interpret these nations as having relatively low inflationary prospects, which currently applies in the United States, which is mixed in with the jumble of Norway, Sweden, Denmark, the Netherlands and the U.K. in the lower left corner of the chart.