Normally, after coming back from a week-long vacation, we would ask if anything interesting happened in the stock markets. But since nothing really unpredictable happened while we were away, we'll just skip over that formality and update our rebaselined charts showing the potential trajectories that stock prices are most likely to take depending upon how far into the future that investors are looking in setting their expectations.
Our first chart shows the finale for the third quarter of 2014:

As you can see, since our last update, investors continued splitting their forward-looking focus between the futures associated with the expectations for 2014-Q4 and 2015-Q2, which continued through the end of the quarter.
But their focus moved to more fully shift to the more distant future defined by the expectations associated with 2015-Q2 as the week progressed. Our next chart shows what our rebaselined model projects that the most likely trajectories that stock prices might follow through the end of the fourth quarter of 2014.

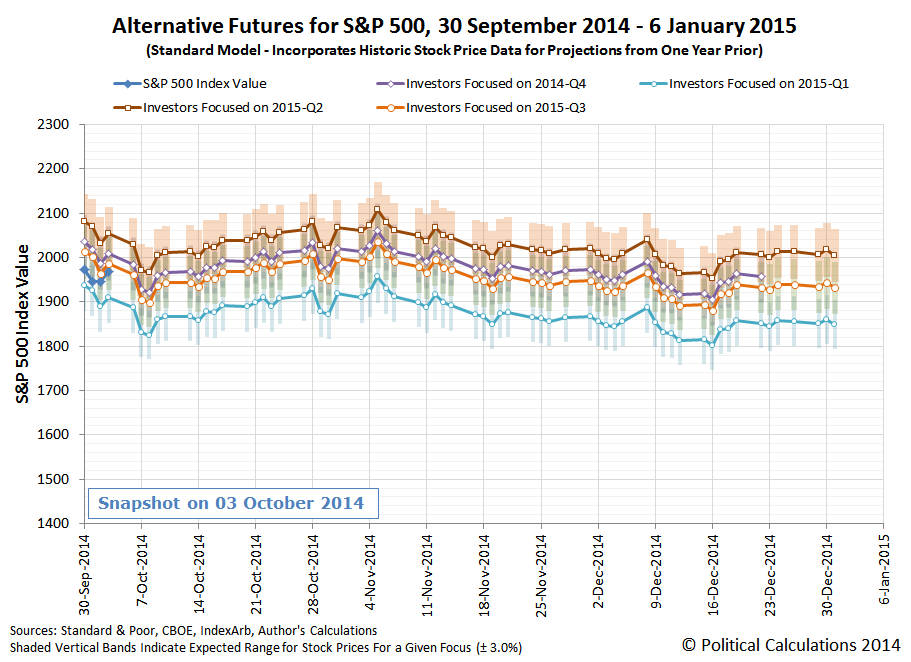
Now, it's important to note that our rebaselined model for projecting stock prices will really only be viable through the middle of this month, as a number of the trajectories that it indicates will begin being increasingly affected by the echoes of the events that impacted the U.S. stock market during the fourth quarter of 2012 - particularly the noise related to the 2012 U.S. presidential election and the subsequent Great Dividend Raid.
Consequently, we'll be returning to our standard model for projecting the most likely alternative trajectories that stock prices are likely to follow since we will no longer have to account for the echo effect from the noise events of one year ago in our projections, which is a result of our model's use of historic stock price data as base reference points for its projections. As our regular readers will recall, we'll soon be coming up to the anniversary of the end of the series of noise events that led us to develop our rebaselined model in the first place, so here's your first look at what those trajectories are more likely to look like from 17 October 2014 through the end of the fourth quarter:
Basically, in the absence of a shift in investor focus to a different point of time in the future or new noise events, the market is most likely to move sideways as stock prices largely keep pace with the expectations associated with the future associated with 2015-Q2. Which makes sense because that's the quarter in which the Federal Reserve is most likely to start messing around with short term interest rates.