Political Calculations' initial estimate of median household income in May 2020 is $65,669, down 0.5% from April 2020's initial estimate of $66,027.
The change is primarily the result of the aggregate loss of wage and salary income recorded for the month as a continuing consequence of the business closures and stay-at-home orders imposed by state and local governments in response to the outbreak of the coronavirus pandemic in the U.S. in March 2020, which has resulted in large scale job losses. Though many of these orders began to be lifted around the U.S. during May 2020, many local jurisdictions are still impose restrictions that contribute to both lost incomes and lost jobs, which slow economic recovery in addition to weighing on the median household income estimate.
While this figure is based on the Bureau of Economic Analysis' current estimates of aggregate personal income, we think the BEA is still underestimating both the extent of job loss and the amount of lost wage and salary income being experienced by millions of Americans, particularly in lower income-earning occupations. We anticipate the BEA will revise its estimates for the month lower in future months as it replaces projections based on pre-coronavirus recession trends with actual income data as it becomes available.
The following chart shows the nominal (red) and inflation-adjusted (blue) trends for median household income in the United States from January 2000 through May 2020. The inflation-adjusted figures are presented in terms of constant May 2020 U.S. dollars.
Median household income in the U.S. has declined by 1.4% from the revised $66,627 recorded in February 2020, the last month of expansion for the U.S. economy identified by the National Bureau of Economic Research, which marks the onset of the coronavirus recession.
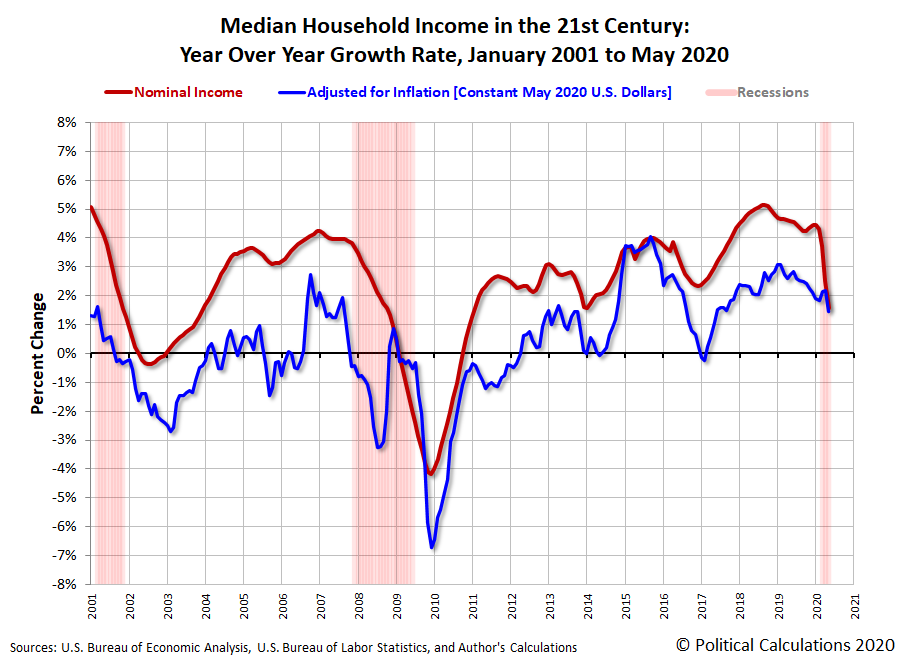
Looking at the year-over-year rate of change for median household income, the following chart confirms the nominal trend has nosed over and has continued sharply decelerating at the fastest rate recorded to date in the 21st century.
Looking ahead, we're starting to see large scale layoffs in the aerospace sector, particularly for the commercial transport portion of the industry, with Boeing having already announced 6,770 job cuts and Airbus just announcing it will be cutting its production by 40%. The effects of the loss of these comparatively high paying jobs should start showing up in the data next several months, where we should recognize the impact will extend through their suppliers, which includes thousands more jobs across the U.S.
Analyst's Notes
The peak value for nominal median household income of $66,627 in February 2020 has been revised very slightly up from our previous estimate of $66,626. We anticipate the aggregate personal income data we use in generating our estimates will be subject to substantial revision given the extent of the coronavirus recession's disruption to the U.S. economy.
Since our estimates are tied to that data, until those revisions occur, we think our estimates will overstate the level of median household income in the U.S. until the economic situation stabilizes.
Other Analyst's Notes
Sentier Research suspended reporting its monthly Current Population Survey-based estimates of median household income, concluding their series with data for December 2019. In its absence, we are providing the estimates from our alternate methodology. Our data sources are presented in the following section.
References
Sentier Research. Household Income Trends: January 2000 through December 2019. [Excel Spreadsheet with Nominal Median Household Incomes for January 2000 through January 2013 courtesy of Doug Short]. [PDF Document]. Accessed 6 February 2020. [Note: We've converted all data to be in terms of current (nominal) U.S. dollars.]
U.S. Department of Labor Bureau of Labor Statistics. Consumer Price Index, All Urban Consumers - (CPI-U), U.S. City Average, All Items, 1982-84=100. [Online Database (via Federal Reserve Economic Data)]. Last Updated: 10 June 2020. Accessed: 10 June 2020.
U.S. Bureau of Economic Analysis. Table 2.6. Personal Income and Its Disposition, Monthly, Personal Income and Outlays, Not Seasonally Adjusted, Monthly, Middle of Month. Population. [Online Database (via Federal Reserve Economic Data)]. Last Updated: 26 June 2020. Accessed: 26 June 2020.
U.S. Bureau of Economic Analysis. Table 2.6. Personal Income and Its Disposition, Monthly, Personal Income and Outlays, Not Seasonally Adjusted, Monthly, Middle of Month. Compensation of Employees, Received: Wage and Salary Disbursements. [Online Database (via Federal Reserve Economic Data)]. Last Updated: 26 June 2020. Accessed: 26 June 2020.

