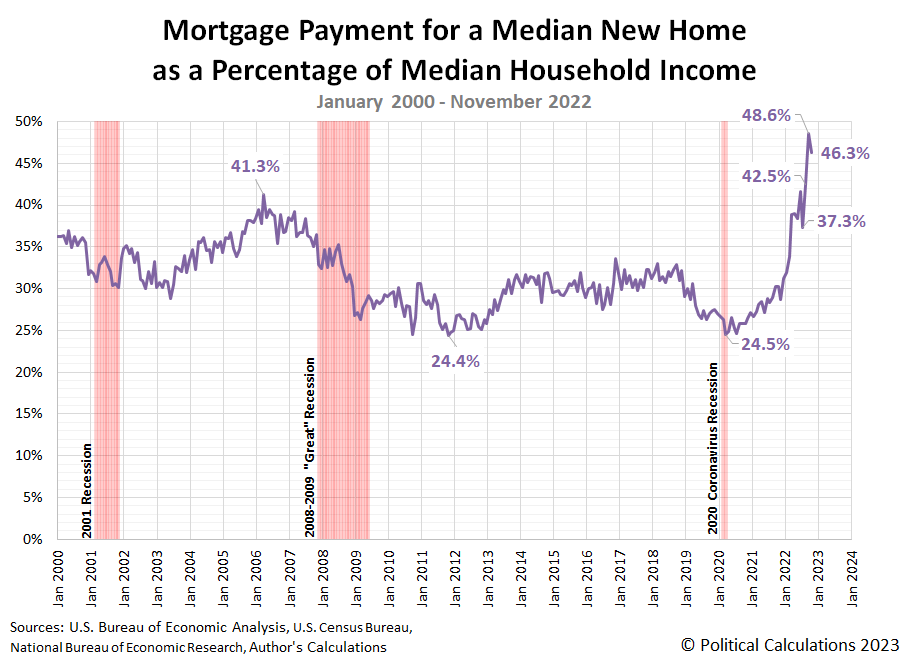
If it wasn't for October 2022's all-time record low for affordability, the cost of owning a new home in November 2022 would itself have set a new record. As it is, the cost of the mortgage payment to live in the median new home sold in November 2022 would consume 46.3% of the wages and salaries earned by a household in the middle of all income-earners in the U.S. That ranks it second behind October 2022's revised all-time high of 48.6%.
Meanwhile, the ratio of median household income to the median new home sale price dropped to an all-time record low of 17.06%. The following chart shows that development for this raw measure of the relative affordability for new homes.
Together, the three months of September through November 2022 represent the lowest level of affordability in U.S. history, with each month exceeding the peak of unaffordability achieved during the first U.S. housing bubble in April 2006.
References
U.S. Census Bureau. New Residential Sales Historical Data. Houses Sold. [Excel Spreadsheet]. Accessed 23 December 2022.
U.S. Census Bureau. New Residential Sales Historical Data. Median and Average Sale Price of Houses Sold. [Excel Spreadsheet]. Accessed 23 December 2022.
Freddie Mac. 30-Year Fixed Rate Mortgages Since 1971. [Online Database]. Accessed 2 January 2023.

