If you saw Reuters' headline for January 2023's U.S. new home sales, you already know most of the story:
U.S. new home sales jump to 10-month high in January, prices fall
Let's get into the raw numbers. Nonseasonally-adjusted new home sales were indeed higher, jumping by 12,000 to 59,000 sales from December 2022's revised estimate. At the same time, the average price of a new home sold in January 2023 plunged by nearly 13%, or $69,800, from the previous month's average to reach $474,400, the lowest figure recorded since August 2022. That combination of sales and average price gives the U.S. new home industry a market cap of $25.2 billion for January 2023, and increase of over $3.3 billion, or 15.3%, from December 2022's level.
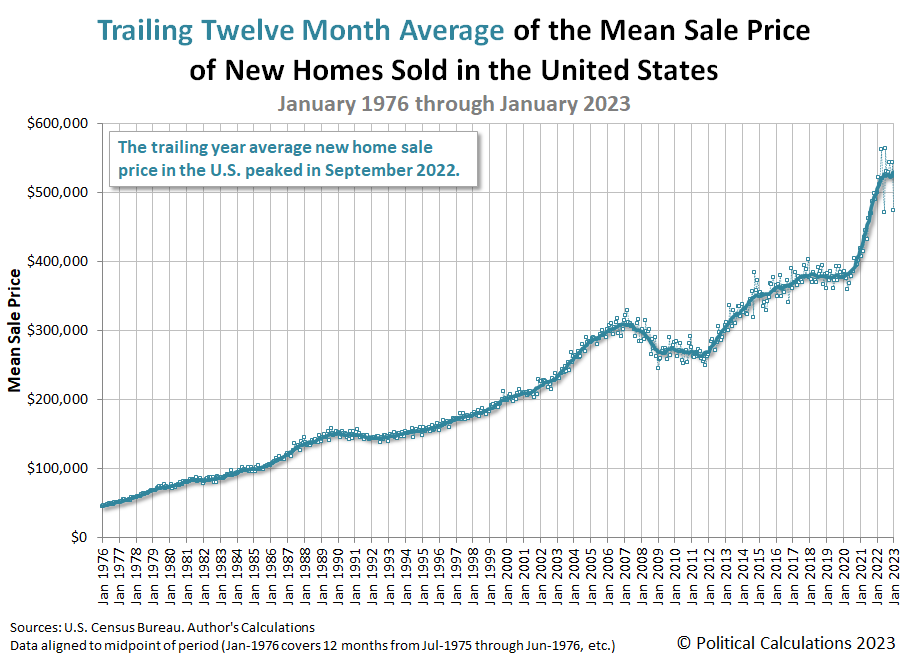
But one month doesn't make a trend, much less break what has been a major downturn for new home builders. Let's look at the time-shifted, trailing twelve month average for each of these measures to see what effect the initial estimates for January 2023's new home have had on the new home market's overall health. Here is the latest update to our chart illustrating the market capitalization of the new home market, spanning monthly data from January 1976 through January 2023.
The partially complete time-shifted rolling twelve month average of the U.S. new home market capitalization for January 2023 is $24.81 billion. That figure represents an increase from December 2022's revised $24.54 billion and is the first month-over-month increase since March 2022. The following two charts show the latest changes in the trends for new home sales and prices:
In terms of the trend, the positive change in sales outweighed the fall in new home sale prices, slowing the overall rate at which the industry's market cap for new home sales is falling.
But there's more to the story. Here are excerpts from Reuters' coverage of January 2023's new home sales, which point to an additional factor that complicates the picture from changing how you might expect from the data:
Sales of new U.S. single-family homes jumped to a 10-month high in January as prices declined, but a resurgence in mortgage rates could slow a much anticipated housing market turnaround....
Mortgage rates have resumed their upward trend after robust retail sales and labor market data as well as strong monthly inflation readings raised the prospect of the U.S. central bank hiking interest rates into the summer.
The 30-year fixed mortgage rate increased to an average of 6.50% this week from 6.32% in the prior week, according to data from mortgage finance agency Freddie Mac. The third straight weekly increase lifted the rate to a three-month high.
We'll take a closer look at how all these changes affected the affordability for new homes in the U.S. sometime next week.
References
U.S. Census Bureau. New Residential Sales Historical Data. Houses Sold. [Excel Spreadsheet]. Accessed 24 February 2023.
U.S. Census Bureau. New Residential Sales Historical Data. Median and Average Sale Price of Houses Sold. [Excel Spreadsheet]. Accessed 24 February 2023.
Image credit: Photo by Tierra Mallorca on Unsplash.


