The negative implications that began with October 2023's new home sales reports continued through the end of 2023.
Since the last time we reported on the size of the new home market in the United States two months ago, annualized sales fell off sharply in November 2023 before going on to recover in December, though to a level lower than they were in October 2023.
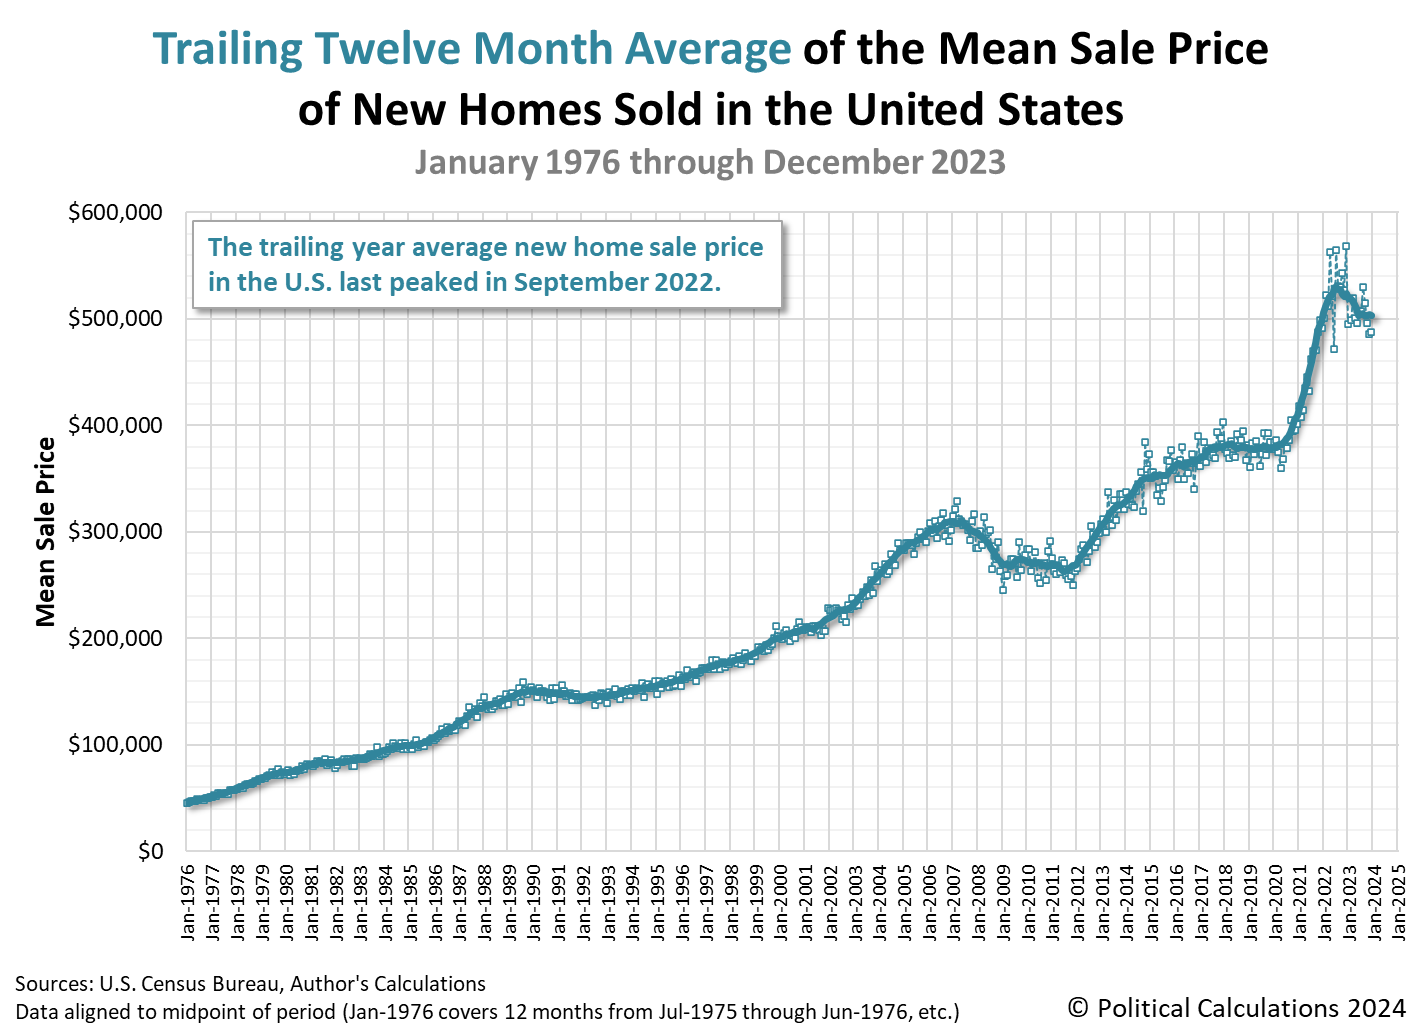
A similar pattern held for the average sale prices of new homes in the U.S. The combination of net declines in the number of new homes sold and the prices for which they sold resulted in a declining trend for the market capitalization of new homes.
All these changes together indicate that what had been an upward trend for the U.S. new home market has broken. Here is the latest update to our chart illustrating the market capitalization of the U.S. new home market since January 1976:
The next two charts show the latest changes in the trends for new home sales and prices:
New home sales typically contribute about 3 to 5% to the nation's Gross Domestic Product. The negative change in trend for the U.S. new home market suggests 2024 has begun with the market contributing a headwind to the U.S. economy.
References
U.S. Census Bureau. New Residential Sales Historical Data. Houses Sold. [Excel Spreadsheet]. Accessed 25 January 2024.
U.S. Census Bureau. New Residential Sales Historical Data. Median and Average Sale Price of Houses Sold. [Excel Spreadsheet]. Accessed 25 January 2024.
Image Credit: Microsoft Bing Image Generator. Prompt: "An aerial photograph of a neighborhood filled with new homes under construction. Highly detailed, photo realistic, 4k."


