
Once upon a time, we found that stock prices are a contemporary indicator of the state of the U.S. economy, meaning that instead of telling us what's going to happen in the future, they tell us what's happening today.
So what exactly is the stock market trying to tell us about what investors are expecting for the U.S. economy?
Let's first look under the hood of the S&P 500. Because changes in the growth rate of stock prices are directly proportionate within a narrow range to changes in the growth rate of their expected underlying dividends per share at defined points in the future, we can use dividend futures data along with current stock prices to determine the extent to which changes in future expectations in the stock market's fundamentals are responsible for the changes we observe in today's stock prices.
The chart below [1] shows where things stand as of Friday, 19 August 2011. We've shifted the dividend data some 7 months to the left, which assumes that investors are currently focused on where the income they can expect to earn from dividends will be at the end of 2011 (the dividend futures data for 2012Q1 covers the period from 17 December 2011 through 16 March 2012.)

Here, we observed that the change in the growth rate of stock prices has sharply decoupled from where their underlying dividends per share would place them. This is a characteristic of what we call a "noise event", which indicates that factors other than those direct expectations are influencing stock prices.
Further, the magnitude of the change is approximately equivalent to the deviation between the two that we observed between April 2010 and September 2010, a period in which deflationary expectations took hold, as it fell between the U.S. Federal Reserve's Quantitative Easing 1.0 (QE 1.0) program and the subsequent Quantitative Easing 2.0 (QE 2.0) program, which recently ended on 30 June 2011.
As we saw then, stock prices have fallen approximately 10% from where they would otherwise be without such noisy expectations at work. The chart below shows the S&P 500's average monthly index value against its trailing year dividends per share to put the two deflationary expectation driven noise events into perspective:
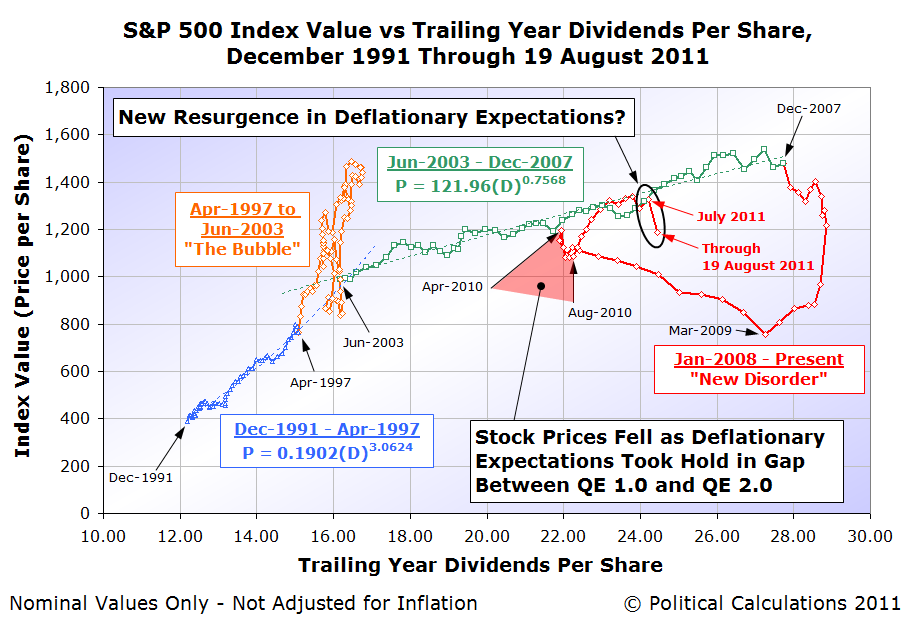
This second chart also provides some insight into the short term noise event we saw from March through April 2011 in our first chart. Here, we are seeing the effects of adjustments the Federal Reserve made to its QE 2.0 program, as it appears that the U.S. central bank was indeed targeting specific stock price levels to correspond with the S&P 500 index' dividends per share in setting the amount of positive inflation generating quantitative easing they were doing at that time.
In effect, once stock prices reached a level that would be consistent the major trend in stock prices that existed from June 2003 through December 2007 for the similar level of dividends per share (shown as the green dashed line in the second chart), the Fed took their foot off the QE gas pedal. That brief deflationary adjustment then shows up as the short term noise event during these two months in our first chart.
Surveying the currently developing economic situation, Jim Hamilton anticipates the Fed's next move with respect to the apparent resurgence of deflationary expectations:
And in response, the Fed should do what, exactly? A new phase of large-scale asset purchases (which doubtless would be referred to in the press as QE3) could sop up a few more percent of publicly-held Treasury debt. Conceivably that could put pressure on the nominal or TIPS yields to decline even further, and I suppose that one might hope that a 10-year real Treasury yield of -0.2% would be slightly more stimulative than the current real yield around zero.
I would suggest that the more important and achievable goal for the Fed should be to keep the long-run inflation rate from falling below 2%. The reason I say this is an important goal is that I believe the lesson from the U.S. in the 1930s and Japan in the 1990s is that exceptionally low or negative inflation rates can make economic problems like the ones we're currently experiencing significantly worse. By announcing QE3, the Fed would be sending a clear signal that it's not going to tolerate deflation, and I expect that would be the primary mechanism by which it could have an effect. Perhaps we'd see the effort framed as part of a broader strategy of price level targeting.
Once that happens, if the Fed continues to use stock prices as its gauge for setting the amount of quantitative easing it will do, we can expect stock prices to begin increasing in response. We anticipate that the market will bottom either this month or in September as the Fed initiates such a program.
Notes
[1] This is perhaps the most complex chart we use to analyze the stock market. In addition to a frequently changing level of change in the expected growth rates of dividends per share and stock prices, investors can shift their focus to different points of time in the future as well, which is why we shift the position of the dividend data from right to left.
Over time, the two track each other within a narrow band of variation quite closely (except during large noise events), which would be easier to see on a time-lapse version of the chart. One important thing to note is that as shown, the historic data for dividends per share shows their final recorded value, rather than the level they were when the changes in expectations they represent were changing stock prices.