Political Calculations
November 4, 2010

Now that the eruption of noise that drove down stock prices in the period from April 2010 into September 2010 appears to have dissipated, where do stock prices stand with respect to their underlying dividends per share today?

S&P 500 Index Value vs Trailing Year Dividends Per Share, December 1991 Through October 2010 
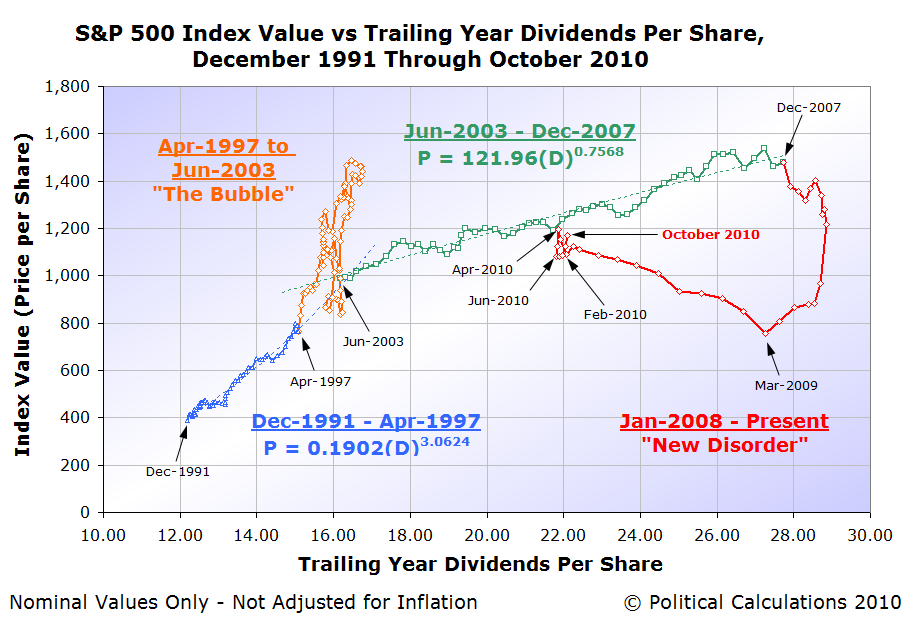
Would you believe it if we said "almost right back where they were in April 2010"? Back before the noise event in the market occurred?

Or better still, just shy of where they were when dividends per share were at the same level they are today back in November and December of 2005? (Is there anyone who still thinks that the general movement of stock prices over time are totally random?)

But still, none of that answers a bigger problem we've been trying to solve over the past several months. In previous noise-driven events, we've been able to identify the proximate source of the noise affecting stock prices. Our best case in point is the noise event of late January 2010, when stock prices dove in response to a sudden increase in uncertainty related to Federal Reserve Chairman Ben Bernanke's re-nomination process.

Like most noise-driven events, once the noise dissipated, stock prices went back to behaving as we would expect and also to levels that we would expect.

InflationData: Monthly Inflation Rate Table, October 2008-September 2010 Taking that example into account, we think we might finally have identified the source of the April-September 2010 noise event: the end of the Federal Reserve's initial quantitative easing program back in March-April 2010.

Here, the Fed's Open Market Committee confirmed the end of what's now known as QE 1.0 on 28 April 2010.

After that point in time, the change in the rate of growth of stock prices dropped far below where the changes in their underlying growth rate of dividends per share would place them.

And then, in September 2010, it became very likely again that the Federal Reserve would implement a new round of quantitative easing, commonly called "QE2" or "QE 2.0". Fed Chairman Ben Bernanke later confirmed the Fed's policy outlook on 16 October 2010, with the description of the size and scope of the new round of quantitative easing coinciding with the end of the FOMC's 2-3 November 2010 meeting.

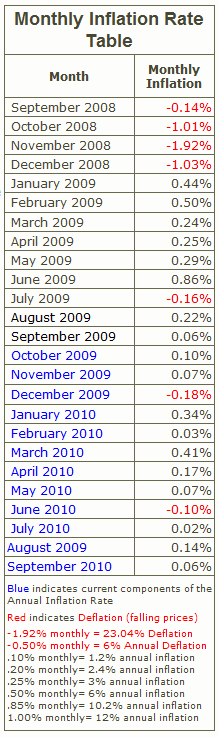
We strongly suspect the noise in the stock market from April 2010 to September 2010 is directly related to the uncertainty investors had for the U.S. inflation rate. In fact, in many ways, the period from April through September 2010 displays a number of deflationary characteristics, which is the primary reason the Fed is initiating QE 2.0.

Without that new round of quantitative easing, it's very likely that investor perceptions of the risk of deflation would lead stock prices to underperform, much as they did during the period from April 2010 into September 2010.

The QE Gap for Stock Prices?  S&P 500 Accelerations of Average Monthly Index Value and Time Shifted, Amplified Trailing Year Dividends Per Share, for 26 October 2010 Dividend Futures

The magnitude of that deflation risk upon the stock market is potentially revealed by our chart showing the change in the growth rates of both stock prices with projected trailing year dividends per share data.

The gap, shown as the blue shaded region, is given by the difference between the lower end of the red-shaded region indicating the typical range in which we would have expected to find the acceleration of stock prices given normal levels of market noise and the blue line indicating the actual trajectory of stock price accelerations.

That this period consisted of very low rates of inflation or outright deflation is confirmed by the data in the table above provided by InflationData.

We'll close by noting that the timing of the Fed's ending and restarting of its quantitative easing program with the gap we've observed is perhaps coincidental. However, we cannot as yet identify any other forces or events that would be capable of disrupting the close coupling that we've observed exists between the accelerations of dividends per share and stock share prices that may also have been at play to the degree that they were during this period of time.

Image Credit: We created an image snapshot of InflationData's monthly inflation rate table on 2 November 2010.

Labels: , , ,


<< Home
Unexpectedly Intriguing!

About Political Calculations


blog advertising
is good for you

Welcome to the blogosphere's toolchest! Here, unlike other blogs dedicated to analyzing current events, we create easy-to-use, simple tools to do the math related to them so you can get in on the action too! If you would like to learn more about these tools, or if you would like to contribute ideas to develop for this blog, please e-mail us at:

ironman at politicalcalculations.com

Thanks in advance!

Recent Posts

Cavalcade of Risk 117

The Trend in U.S. Layoffs on Election Day

The Wrong Path

On the Moneyed Midways - October 30, 2010

How Big Should Your Kid's Halloween Bucket Be?

Predictions Plus-Minus Update

The Odds of That

Trick or Treat Taxes!

The S&P 500 Next: 1200

On the Moneyed Midways - October 22, 2010

Elsewhere on the Web

This year, we'll be experimenting with a number of apps to bring more of a current events focus to Political Calculations - we're test driving the app(s) below!

Most Popular Posts

The S&P 500 at Your Fingertips

The Distribution of Income for 2010: Individuals

Should You Trade in Your Gas Guzzler?

What Are the Chances Your Marriage Will Last?

Tipping Around the World

What's Your Body Fat Percentage?

The Odds of Dying, Again!

Gas Prices, the Unemployment Rate, and Desperation

Hauser's Law

The Real Story Behind "Rising" U.S. Income Inequality

Quick Index

First Time Visitor to Political Calculations?

On the Moneyed Midways

A Lot, But Not All, of Our Tools

U.S. GDP Temperature Gauge

Political Calculations' GDP Temperature Gauge, 2013Q1 First Estimate Political Calculations' U.S. GDP Temperature Gauge provides a means to quickly evaluate the growth rate of the U.S. economy against the backdrop of how the economy has performed since 1980, with the "temperature" color spectrum ranging from a recessionary "cold" (purple) through an expansionary "hot" (red).

The GDP Temperature Gauge presents both the annualized GDP growth rate as reported by the U.S. Bureau of Economic Analysis reports for a one-quarter period and also as averaged over a two quarter period, which smooths out the volatility seen in the one-quarter data and provides a better indication of the relative strength of the U.S. economy over time.

Site Data

This site is primarily powered by:

This page is powered by Blogger. Isn't yours?

Visitors since December 6, 2004:

CSS Validation

Valid CSS!

RSS Site Feed

AddThis Feed Button

JavaScript

The tools on this site are built using JavaScript. If you would like to learn more, one of the best free resources on the web is available at W3Schools.com.

Other Cool Resources

ZunZun - Exceptional regression analysis tool.
Wolfram Integrator - Solve integrals. Do calculus!
Create a Graph - Easy-to-use basic graph-making tool.
Many Eyes - Data visualization extraordinaire!
Wolfram Alpha - Computational knowledge engine.
Khan Academy - Math & science video mini-lectures!
Picasion - Animate images.


Archives
December 2004
January 2005
February 2005
March 2005
April 2005
May 2005
June 2005
July 2005
August 2005
September 2005
October 2005
November 2005
December 2005
January 2006
February 2006
March 2006
April 2006
May 2006
June 2006
July 2006
August 2006
September 2006
October 2006
November 2006
December 2006
January 2007
February 2007
March 2007
April 2007
May 2007
June 2007
July 2007
August 2007
September 2007
October 2007
November 2007
December 2007
January 2008
February 2008
March 2008
April 2008
May 2008
June 2008
July 2008
August 2008
September 2008
October 2008
November 2008
December 2008
January 2009
February 2009
March 2009
April 2009
May 2009
June 2009
July 2009
August 2009
September 2009
October 2009
November 2009
December 2009
January 2010
February 2010
March 2010
April 2010
May 2010
June 2010
July 2010
August 2010
September 2010
October 2010
November 2010
December 2010
January 2011
February 2011
March 2011
April 2011
May 2011
June 2011
July 2011
August 2011
September 2011
October 2011
November 2011
December 2011
January 2012
February 2012
March 2012
April 2012
May 2012
June 2012
July 2012
August 2012
September 2012
October 2012
November 2012
December 2012
January 2013
February 2013
March 2013
April 2013
May 2013

Blog Roll

Bloodhoundblog
Budgets Are Sexy
Cafe Hayek
Carpe Diem
Core77
Coyote Blog
Craig Harper
Darwin's Finance
Digerati Life, The
Division of Labour
Dough Roller, The
Eclectecon
Econlog
Economics Roundtable
EconomicsUK
Environmental Economics
Escape from Cubicle Nation
Execupundit
FiscalGeek
Get Rich Slowly
Gongol
Good Financial Cents
HR Bartender
Hot Air
i4cp Productivity
Innocent Bystanders
Innovation and Growth
Instapundit
Intangible Economy
I've Paid Twice for This Already
Joanne Jacobs
Kaus Files
Len Penzo dot Com
Making Ripples
Market Power
Mechonomics
Mighty Bargain Hunter
Monevator
My Dollar Plan
New Economist
Newmark's Door
Nina Simosko
Physorg
Private Sector Development
Real Clear Politics
Richard Fernandez
Roger L. Simon
Rowan Manahan
Sound Politics
SOX First
Sports Economist, The
squawkfox
Three Star Leadership
Tim Worstall
Townhall
Trusted Advisor
Uncommon Misperceptions
voluntaryXchange
WILLisms
Winterspeak

Market Links

Big Picture, The
Crackerjack Finance
CXO Advisory Group
Disciplined Approach to Investing
Dividend Guy, The
Doug Short
Evidence Investing
Fat Pitch Financials
FX Investment Strategies
Oilprice

Charities We Support

American Red Cross
Children's Heart Foundation
Salvation Army
SMA Foundation

Recommended Reading

Kindle Paperwhite 3G - Best e-reader!
Angel in the Whirlwind
Bailout Nation
Cartoon Guide to Statistics
A Comprehensive Guide to the Peloponnesian War
The Complete Personal Memoirs of Ulysses S. Grant
The Count of Monte Cristo
Ender's Game
Gardner's Art Through the Ages
Empire of Wealth
How to Make Presentations to Councils and Boards
Juran's Quality Handbook
Marks' Standard Handbook
The Second World War
Stocks for the Long Run
Why Smart Executives Fail

Recommended Viewing

The Tudors: The Complete Series

Recently Shopped

Kindle Fire HD 8.9" 4G LTE Wireless 32 GB
Snap Circuits Jr. SC-100
Nerf Vortex Praxis
Sony BRAVIA 40" LED HDTV
2540 Series Docking Station
New Balance MX623
Dunham Men's Waterproof Oxford
TN360 Black Toner Cartridge
The Dangerous Book for Boys
Air Swimmer Remote Control Inflatable Flying Shark
Fisher-Price Little People Lil Pirate Ship

Seeking Alpha Certified