The Tax Foundation has just released its third State Business Climate Index, in which it presents its rankings of each state's "business-friendliness" with regard to taxation. Links to more information about the study are available at the Tax Foundation's blog, which includes a static table listing the rankings of the states by alphabetical order.
But really, is that kind of data presentation good enough anymore? We here at Political Calculations believe that data presented in tables on the Internet should do more than just sit there. Oh no. We believe that data presented this way should dance on the reader's command, rearranging itself to allow the reader to gain more insight than by having to search through hundreds of individual data points to find out if their state scored higher in one category than another.
That's why we're presenting our own dynamic version of the Tax Foundation's state-by-state rankings. Just select any of the column headings below to rank the presented data according to the category you select, either from low to high or from high to low (by clicking again!) We've also highlighted the individual states of Arizona (green), since it came in the middle of the Tax Foundation's overall rankings, as well as the highest ranking state Wyoming (red), and the lowest ranked state of New York (blue).
| Tax Foundation 2006 State Business Tax Rankings |
|---|
| State | Overall Rank | Business Tax Index Rank | Individual Income Tax Index Rank | Sales and Gross Receipts Tax Index Rank | Unemploy-ment Insurance Tax Index Rank | Wealth Index Rank |
|---|---|---|---|---|---|---|
| Alabama | 14 | 14 | 17 | 11 | 4 | 6 |
| Alaska | 3 | 48 | 4 | 1 | 43 | 18 |
| Arizona | 25 | 29 | 20 | 40 | 12 | 12 |
| Arkansas | 41 | 44 | 32 | 37 | 41 | 13 |
| California | 40 | 39 | 47 | 38 | 20 | 7 |
| Colorado | 12 | 6 | 14 | 26 | 21 | 14 |
| Connecticut | 39 | 16 | 19 | 33 | 26 | 50 |
| Delaware | 8 | 25 | 26 | 3 | 11 | 10 |
| Florida | 4 | 13 | 4 | 20 | 1 | 16 |
| Georgia | 21 | 8 | 27 | 7 | 32 | 27 |
| Hawaii | 33 | 26 | 44 | 43 | 22 | 3 |
| Idaho | 24 | 21 | 37 | 17 | 46 | 2 |
| Illinois | 23 | 15 | 13 | 41 | 37 | 44 |
| Indiana | 11 | 20 | 10 | 14 | 7 | 19 |
| Iowa | 42 | 46 | 45 | 13 | 28 | 29 |
| Kansas | 34 | 45 | 23 | 28 | 15 | 33 |
| Kentucky | 44 | 40 | 30 | 23 | 48 | 30 |
| Louisiana | 36 | 34 | 22 | 49 | 9 | 28 |
| Maine | 45 | 47 | 38 | 10 | 42 | 39 |
| Maryland | 22 | 7 | 39 | 8 | 17 | 37 |
| Massachusetts | 27 | 36 | 15 | 9 | 49 | 41 |
| Michigan | 26 | 49 | 11 | 32 | 40 | 20 |
| Minnesota | 38 | 41 | 36 | 34 | 35 | 15 |
| Mississippi | 29 | 33 | 16 | 46 | 2 | 26 |
| Missouri | 20 | 4 | 25 | 29 | 8 | 17 |
| Montana | 9 | 17 | 21 | 5 | 24 | 23 |
| Nebraska | 43 | 42 | 34 | 36 | 14 | 42 |
| Nevada | 5 | 1 | 7 | 47 | 38 | 11 |
| New Hampshire | 6 | 38 | 8 | 2 | 44 | 31 |
| New Jersey | 49 | 50 | 46 | 27 | 27 | 46 |
| New Mexico | 28 | 31 | 24 | 48 | 18 | 1 |
| New York | 50 | 30 | 50 | 39 | 47 | 43 |
| North Carolina | 37 | 22 | 43 | 35 | 5 | 40 |
| North Dakota | 31 | 35 | 42 | 18 | 36 | 4 |
| Ohio | 47 | 37 | 48 | 45 | 13 | 48 |
| Oklahoma | 17 | 8 | 28 | 15 | 3 | 21 |
| Oregon | 10 | 24 | 33 | 4 | 30 | 8 |
| Pennsylvania | 16 | 32 | 12 | 19 | 16 | 45 |
| Rhode Island | 48 | 27 | 40 | 30 | 50 | 49 |
| South Carolina | 30 | 12 | 29 | 12 | 45 | 32 |
| South Dakota | 2 | 1 | 1 | 42 | 31 | 9 |
| Tennessee | 15 | 11 | 9 | 44 | 33 | 38 |
| Texas | 7 | 18 | 4 | 21 | 6 | 34 |
| Utah | 18 | 5 | 31 | 24 | 23 | 5 |
| Vermont | 46 | 43 | 49 | 16 | 10 | 47 |
| Virginia | 19 | 8 | 18 | 6 | 25 | 36 |
| Washington | 13 | 19 | 2 | 50 | 39 | 24 |
| West Virginia | 35 | 28 | 41 | 31 | 34 | 22 |
| Wisconsin | 32 | 23 | 35 | 25 | 29 | 25 |
| Wyoming | 1 | 1 | 2 | 22 | 19 | 35 |
About the Dynamic Table
The table sorting function used by Political Calculations to provide this dynamic capability was developed by the minds of the Daily Kryogenix who, in addition to creating the function, have provided really good instructions for implementing the capability onto web sites (or, in this case, blogs.)
Just days following this year's State of the Union address, in which the President proposed increasing the amount of support for providing science and math education in the U.S., something remarkable is happening: the national media is running op-ed pieces questioning the need for improved math and science education in the United States.
Aside from the snarky pleasure we get from reading the Washington Post op-ed columnist Richard Cohen's admission1 that he lacks the essential cognitive ability to discuss any issue where math and algebra might be involved in public policy decision-making, which we note includes such topics as taxation and government spending, the question we have to ask is: "Why is the national media pushing these stories now?"
The reason may be simple and straightforward. The President's proposal would bring up to 30,000 active practicioners of math and science into classrooms across the nation to help teach students these subjects, which would reduce the role of the card-carrying teachers' union members who have the sole responsibility of doing the job now. What are the odds that the members of the "education" lobby are happy with that aspect of the President's proposal? Answer: they're not.
But better yet, the President's proposal has put the "education" lobby's leadership in an awkward position for the following reasons:
- They can't deny that the vast majority of their profession is substantially less capable in the practice of math and science than those coming from other academic backgrounds. This fact was determined objectively by comparing the performance of education majors on standardized graduate school admission tests between 1962 and 1982. While no comprehensive study has yet been released to update the findings of that original study, those who have reviewed the study recently indicate that the relative performance of the various academic majors has continued into the present day.
- The performance of U.S. students on standardized math and science exams and evaluations shows that compared to other students in the world, the U.S. does well (average or better) up through the eighth grade and falls off considerably afterward. In other words, the problem is not the kids - it's the teaching. In particular, the teaching at the upper grade levels where much more advanced math and science concepts are introduced in secondary school curriculums. Since the teachers' unions have used their political influence to restrict who may teach in a classroom to those with education degrees by law in many states, they and their political agents are solely responsible for this outcome.
- They can't come right out and openly oppose improving math and science education by placing these highly qualified individuals to help teach the subjects in the classroom. (Perhaps learning their lesson from a previous union leader's openness about their priorities.)
So it would seem that what we have instead is opposition by proxy, promoted by the teachers' unions' sympathetic accomplices in the media that say: "We really don't need more people who have strong educations in math and science" backed with polling data taken from the wrong people to ask about what math and science skills are needed by employers.
Even more amazing as these stories are in direct conflict with the usual editorial position advocated in the major media outlets that schools deserve more money for education programs.
Meanwhile, there are precious few editorials these days that say "We're not investing enough in improving math and science education in the U.S."
What a truly amazing state of affairs in the world of education today.
1 "I confess to be one of those people who hate math. I can do my basic arithmetic all right (although not percentages) but I flunked algebra (once), barely passed it the second time -- the only proof I've ever seen of divine intervention -- somehow passed geometry and resolved, with a grateful exhale of breath, that I would never go near math again." - Richard Cohen, Washington Post op-ed columnist.
Update: Not quite related, but still well worth reading on the "education" lobby's efforts to undermine public school programs established for gifted students.
Labels: education
With Willisms having recently blown past the 400,000 site visit threshold, we broke with our usual policy of ignoring our own site traffic statistics and realized that yesterday, Political Calculations passed the 50,000 mark!
Our 50,000th visitor found Political Calculations came to us from Canada through a random search. Literally. Here's the screen shot to prove it:

That's pretty remarkable! Especially so since, looking over our other recent international traffic indicates that the most common way people overseas are finding Political Calculations in recent days is by searching specifically for "Mazen al-Tumeizi" (suggesting that there may be a degree of anti-U.S. fan-flaming going on since this reporter's death in Iraq is pretty old news).
Interesting.
Once again, we here at Political Calculations have sorted through all the business, personal finance, investing, debt reduction, economics and other money-related posts from this week's blog carnivals so you don't have to! The best posts this week follow:
Carnival of the Capitalists
- Real Madrid: The Importance of the Brand
Mark at Sportsbiz shows how Spain's Real Madrid became the world's richest football team by developing the power of its brand.
- Prosper People-to-People Lending Marketplace
Last week, we cited a post announcing the arrival of peer-to-peer lending in the U.S. Jim at the Blueprint for Financial Prosperity offers a look at the potential pitfalls in participating in Prosper's person-to-person proposition. [Did you do that without a thesaurus? -ed. Yep. Stop it. Now. You're the boss.]
Carnival of Personal Finance
- Is Wealth Bad?
Jared Iverson and Richard Miller, the minds behind the beautifully designed Firevalt blog, note that whether an individual creates value or not for the economy determines the answer to the question, and finds that on the whole, making money and building wealth is a good thing.
- Reverse Carnival of Money Mistakes
MyMoneyBlog hosts a "Reverse Carnival," detailing the personal experiences of many personal finance bloggers' worst errors in money matters. Maybe the best post of the week!
- Dealing with the Loss of People Resources
Yaro Starak of Entrepreneur's Journey ventures into what options are available to a manager should their small business lose members of their staff.
Carnival of Entrepreneurship
- Things to Remember When Bootstrapping Your Start-Up
Benjamin of I Got News For You offers his list of nine things to remember when you start your own business.
- 10 Steps of Marketing with No Money -- Then Sell Out
Jack Yoest provides real life lessons in how to market a product when your business doesn't have the money to do the job the "traditional" way.
Carnival of Investing
- The Biggest Risk
Dan Melson of Searchlight Crusade identifies the biggest risk in financial planning.
Festival of Frugality
- Money Saved Using Compact Fluorescent Bulbs
This entry from the Blueprint for Financial Prosperity is exactly the kind of post that
mightwill inspire a tool here!- Laundering Stamps
Did you ever put a book of stamps through the laundry? Five Cent Nickel did, and found that the U.S. Postal Service has a way to recover most of the value of the damaged stamps. Who knew?
What are the odds that the guys at Fraters Libertas are waking up this afternoon, blearily looking through their e-mail, and wondering: "When did we do that?" And possibly: "Was that us?"
Just what do economists do? And why doesn't any discussion of what economists do *ever* include the word "economize"?
When do public officials support junking a major public works project? When they'd rather use the dedicated taxes being collected for the failed project for other boondoggles.
Beyond burger flipping: How much you want to bet that Wal-Mart will pioneer the wide-spread adoption of this technology in Maryland, assuming the law there isn't tossed out in court?

Captain Ed recently dissected a poorly considered New York Times' editorial concerning what a tolerable level of aspartame (aka Nutrasweet) consumption might be. We here at Political Calculations(TM) aren't going to enter into the debate over the scientific merits, or the potential lack thereof, in the study driving the New York Times editorial board's hysteria, but we will put together a tool to help you figure out just how much Nutrasweet might be at stake for you!
All you need to do is to enter your personal data in the table below and we'll figure out how many typical cans of diet soda (roughly 225 mg per 12-oz can) you could consume, or how many of those packets of Nutrasweet (assuming 45 mg per packet) you might "safely" go through in the course of a day.
But that's not all! Because we just have this feeling that the daily amount of aspartame (in milligrams) per unit of body weight (in pounds) that defines the "healthy" limit that an individual might consume might be bouncing around quite a bit, we've made this figure one you can enter into the calculations. We've plugged in the new "proposed" healthy limit, but you should know that the current maximum intake recommendation is 50 mg for every 2.2 lbs (or 1 kg) of body weight per day.
Had enough explaining? Here's the tool!
Ain't math fun?!
Did you ever wonder about the relative mental horsepower required by various academic and professional disciplines? Does it, for instance, take more smarts to get a degree in Chemistry than it does to get one in Business? And how could you find out rather than make a bunch of chemists and business people take IQ tests?
One of the things you could do is look at how individuals with undergraduate degrees in various majors perform on standardized graduate school admission tests. By comparing the performance of people on tests like the Law School Admissions Test (LSAT), the Graduate Management Aptitude Test (GMAT) or the Graduate Record Examination, it should be possible to get a really good feel as to how smart the people who graduate from these disciplines are relative to one another.
As it happens, there has been such a study. Clifford Adelman researched and analyzed 20 years of graduate school admission test data in The Standardized Test Scores of College Graduates, 1962-1982 and found that there were clear differences between those with degrees in different disciplines. The following dynamic table presents some of Adelman's findings and allows you to rank the listed majors according to how well they did on the indicated exams (by clicking the column headings):
| Standardized Test Performance by Undergraduate Major, 1962-1982 |
|---|
| Percentages by which the average scores of majors in each field were above or below the average score of all test-takers. |
| Undergraduate Major | LSAT | GMAT | GRE Verbal | GRE Math |
|---|---|---|---|---|
| Biology | F4.0 | E3.3 | G5.4 | H8.0 |
| Business | B-4.5 | A-5.0 | B-9.1 | E-2.3 |
| Chemistry | H7.6 | H7.5 | E2.1 | I18.3 |
| Education | A-8.7 | B-4.2 | A-10.4 | A-15.8 |
| Engineering | I8.0 | I10.0 | C-7.3 | J25.1 |
| English | G5.6 | F4.1 | I14.5 | B-5.7 |
| History | E2.9 | G4.6 | H10.8 | C-5.5 |
| Philosophy | J8.7 | J11.0 | J17.6 | G4.6 |
| Political Science | C-1.6 | D0.6 | F3.5 | D-5.0 |
| Sociology | D-0.7 | C-0.5 | D-0.7 | F-1.5 |
Overall, the results generally follow what common sense would predict - engineers do exceptionally well in demonstrating math proficiency but below average in verbal skills (at least on the GRE!) Conversely, we see the opposite pattern for English majors on the same tests, which we would also expect! Overall, the best performances were turned in by those with degrees in philosophy. Adelman noted (via George MacDonald Ross) that:
Students who major in a field characterized by formal thought, structural relationships, abstract models, symbolic language, and deductive reasoning consistently outperform others on these examinations.
The notable exception is the performance of education majors, which I've highlighted in the table above. Education majors, the majority of whom typically go on to become teachers, fall to the bottom of the rankings rather than being near the overall averages on the exams, as one might reasonably expect since they couldn't be considered to be "specialists" with respect to any given tested material. As it turns out, this is a shared characteristic of "vocational" degree programs, which includes education-related fields. Adelman comments (again, via George MacDonald Ross):
Driven by the requirements of specialized accrediting bodies, the curricula in many of these areas tend to be confined to very few fields, none of which require the exercise or development of the verbal skills necessary to perform well on examinations such as these. Nor do any of these professional/occupational 'disciplines' have strong knowledge paradigms, structures that require the rigorous exercise of analysis and synthesis that is so often reflected on the tests.
And so, we have the situation where the people most responsible for the preparation of young people to even enter college are the least capable of exercising the skills needed to succeed there. Especially as compared to those with degrees in nearly every other academic discipline. This fact becomes even scarier when you consider that subsequent, more limited research suggests that the overall pattern of performance by academic major has remained static in the years since the original study.
Given this information, is it any wonder that the President proposed improving math and science education by bringing active practioners of those disciplines into the classroom in this year's State of the Union address? Or should we perhaps be disappointed that the proposal is limited to just math and science and doesn't go far enough? In either case, it's a change that needs to happen, the sooner, the better. To borrow a phrase from Michael Ledeen, "Faster, please."
It's time for a quiz! Today's $8.2 trillion dollar question is:
How do bureaucrats solve problems?
Your choices are:
A. With speed and efficiency.
B. With careful study by dedicated subject matter experts, who precisely determine the optimum allocation of resources needed to achieve a desired outcome, who then enact the solution while gathering essential feedback from its execution to adjust its operation as required to ensure ongoing satisfactory performance.
C. With more bureaucracy.
If you answered anything other than C, you're probably Paul Krugman. And if you doubt C is the answer, consider this report from the U.K. (HT: Heritage Policy Blog).
[And you thought the state of dental health in Britain was bad before. - Ed. ]
Update (26 February 2006): More evidence from the U.K. (via the Mises Economics Blog, which also confirms Paul Krugman's preference for bureaucracy rule in health care.
Labels: politics
So many blog carnivals and so little time! Even though we've throttled back our posting activity here at Political Calculations, we still try to keep up with the best out there in the world of personal/micro/macro-economics-related blogging activity. Here are what we've determined to be the best posts (the money posts!) about business, personal finance, investing, debt reduction, economics and more from this week's blog carnivals!
Carnival of Personal Finance
- Things Worth Spending On
Cathy, aka the Chief Family Officer, offers her thoughts on what the best use of your money might be.
- Spend as much on crap as you can afford
Maybe the most inspired post anywhere this week! Certainly a great counterweight for the previous selection, Retire at 30 finds that "you can be financially responsible and splurge on stupid things!"
Carnival of the Capitalists
- Paul Krugman and VA Health Care
Different River joins in the ever popular blogging activity of dissecting the error-filled, myopic ruminations put forth by the New York Times' top economics thinker in a recent column. Guess which one's version provides a more accurate picture of what quality health care looks like when a government agency provides it?
- Recession Threat Growing
Is the U.S. headed to recession? Michael Cale of Financial Methods thinks the probability of a recession in the next 12-18 months has increased substantially.
- New Investment Opportunity? Person to Person Lending
We've had peer-to-peer networks for years where digital music, gaming and other entertainment options are involved, but Jeffrey Strain at Personal Finance Advice may have found the loan-industry equivalent with Prosper.com.
Carnival of Entrepreneurship
- Is Invention Dead?
The Strangest Secrets' Carson Conant wonders if entrepreneurs can overcome the challenge of the growing complexity of technology.
- Ten Steps to a Business Turnaround
Rick Spence, aka the Canadian Entrepreneur, reports from a conference at the University of Toronto with a list that more organizations ought to follow when the going gets tough. You know, like Rock the Vote could have, if the MTV people who run it really cared....
Carnival of Investing
- Investing: And he's an expert!
The Big Cajun Man of Canadian Financial Stuff has some choice quotes from a so-called expert, which reminds us that there's no substitute for doing your homework when choosing your investments.
- "But You Are The Man"
Want to know how to really stick it to "The Man?" Uncle Bill says maxing out your 401(k) or other employer-sponsored retirement plan is the perfect stick - especially if your employer matches all or part of your contributions. Best advice of the week!
Carnival of Debt Reduction
- Starting a business without more debt
The MightyBargainHunter offers suggestions for modern entrepreneurs on how to launch a business with low-to-no debt.
Festival of Frugality
- Living on Less, Having an Abundance
Frugal for Life's Dawn looks at the psychology of thrift. Does your brain have a "scarcity-switch"?
It has often been said that two things in life are certain: death and taxes. In reality, there's a third certainty to go along with the first two: while people are alive, they'll attempt to avoid the taxes.
What brings this up is a recent paper by David Joulfaian on The Behavioral Response of Wealth Accumulation to Estate Taxation: Time Series Evidence, which is available online as a 562KB PDF document (HT: The Tax Foundation's Tax Policy Blog.)
Part of the paper's approach is very interesting - Joulfaian determines what the equivalent income tax would be if the estate tax were levied all through life, as opposed to just at the end. That kind of math is too interesting to pass up, and Political Calculations offers the following tool, which may be used to estimate what additional percentage of their income an individual would have to pay if the estate tax were levied this way.
The default data in the table below is for a 21 year old man (with a 54.6 year remaining life expectancy), who will earn a 10% nominal rate of return on his assets, and who may expect to have his estate taxed at the 55% estate tax rate.
Looking at the estate tax in this way, is it any wonder that so many people (particularly the very wealthy) invest so much time and energy in life to avoid having to pay estate taxes? The increased equivalent income tax imposed by the estate tax is driven home in the following chart, taken from Joulfaian's paper, which illustrates the effective income tax rate for a variety of different investment rates of return and age:
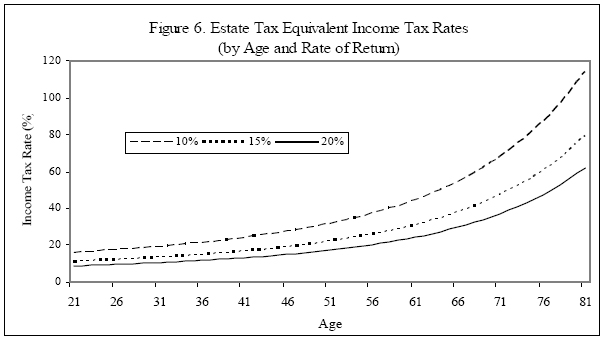
Joulfraian estimates that if not for tax avoidance strategies, the taxable amount of estates subject to the tax would be 14 to 27% greater.
What's really amazing though is how little money (as a percentage of total tax receipts) that the U.S. government collects in estate and gift taxes. The following image shows the relative amounts of the various kinds of taxes levied by the U.S. government on the left (HT: The Big Picture):
The $23.7 billion USD of estate taxes that Uncle Sam will collect in 2007 amounts to less than 1% (0.98%) of the anticipated $2.416 trillion USD total of all tax revenues, which makes one wonder why the government should even bother imposing the tax at all? What would happen?
In the conclusion to his paper, Joulfaian finds that: "in the absence of the estate tax, there will be no longer a need to engage in estate planning and employ strategies designed to reduce the reported value of assets." When you consider how successful those facing the estate tax are at avoiding it, and how little it means to the financial well being of the nation, it would seem wise to encourage these individuals to pursue more productive uses of their time by eliminating the death tax altogether.
Is the Democratic Party the party of the angry left, so much as it is the party of the angry left-overs?
Are big-money donors doing an end-run around the McCain-Feingold law by putting the candidates they're grooming on their payroll and "pre-funding" them?
So, how is it possible for Americans to work more *and* have more leisure time than Europeans?
Speaking of economics, what are the odds of Saul Moogman ever being asked to take on another speaking engagement?
Finally, if it wasn't, what was it?
Did you ever wonder what the most ineffective government programs are in the U.S.? We're not just talking about the programs that can't demonstrate if they're performing or not, but rather those programs that are proving to be actively wasting the tax dollars they receive through their chronic inability to achieve worthwhile results. In other words, truly ineffective government programs. Here's a short list of some of the least effective U.S. government programs, as identified by the White House's ExpectMore.gov web site:
| Sample of Ineffective Government Programs | ||||
|---|---|---|---|---|
| Department/Agency | Program | Budget (millions $USD) | ||
| 2005 | 2006 | 2007* | ||
| Education | Even Start | 225 | 99 | 0 |
| Energy | Oil Technology | 34 | 32 | 0 |
| Health & Human Services | Health Professions | 450 | 295 | 159 |
| Justice | Juvenile Accountability Block Grants | 54 | 49 | 0 |
| Labor | Trade Adjustment Assistance | 1057 | 966 | 939 |
| Transportation | Amtrak | 1207 | 1294 | 900 |
| Treasury | IRS Earned Income Tax Credit Compliance | 165 | 167 | 168 |
| Environmental Protection Agency | EPA Ecological Research | 87 | 85 | 80 |
| Corp. for National & Community Service | AmeriCorps National Civilian Community Corps | 25 | 27 | 5 |
In all, 28 programs appear on ExpectMore.gov's list of ineffective programs, which account for 3.5% of the 805 federal government programs that were reviewed by the White House's Office of Management and Budget. Together, these programs consumed $19,793,000,000 ($19.8 billion USD) in 2005. In 2006, the amount Congress has enacted to support these programs adds up to $17,494,000,000 ($17.5 billion USD), and the President's recently released budget request for 2007 proposes spending $14,773,000,000 ($14.8 billion USD), a 15.6% decrease ($2.7 billion USD) from the amount budgeted for these programs for 2006. (All figures taken or derived from the spreadsheet for the Fiscal Year 2007 Budget Request assembled by the White House.)
Today, Political Calculations is diving into the latest Blog Carnivals to identify the best posts of the past week on the topics of business, personal finance, investing, or any and all other money-related topics! Here's what we found, and where we found them:
Carnival of Investing
The Carnival of Investing is hosted by the Wealth Junkie blog. The best posts of the week are:
- Super Bowl Stock Market Indicator
How's this for perfect timing? Jim at the Blueprint for Financial Prosperity is testing whether the Steelers' win in the Superbowl will result in the stock market being up this week.
- Statistical Investing Using the Magic Formula
It may be because we're reading Joel Greenblatt's book at the moment, or it may be our affinity for investing-related math, but Old Niu's post on the topic of statistical investing is well worth reading.
Carnival of Debt Reduction
This week's Carnival of Debt Reduction is being hosted by Free Money Finance. The best debt-reducing post of the week is:
- Not paying off 30-year mortgage a good deal?
When is not paying off a long-term loan a better deal? The MightyBargainHunter focuses on the role of inflation in making debt cheaper.
Carnival of Entrepreneurship
The first ever Carnival of Entrepreneurship is up and running at the Entrepreneur's Blog!- Where Are the Turnaround Products?
David Daniels of Business and Technology Reinvention notes that it takes more than new products to turn around an ailing company - it takes whole new product categories to do the job right. Best post on all the midways this week!
Carnival of Personal Finance
The Carnival of Personal Finance is hosted by Financial Reference this week!
- Cash Back Credit Card Calculator
We here at Political Calculations have a special affinity for anyone who posts tools to do math on their blogs. Heck, we like to think that we pretty much invented the concept, and would like to know if we were, in fact, the first! It's only been recently that we've found others venturing out into the tool-making and posting world, so that's why we're highlighting Financial Revolution's tool for determining what your cash back rebate might be from your credit card. Neat application!
- Growth Rate Calculator Toy
And let's not forget Nathan Whitehead's contribution in The Paranoid Brain, who is getting into the action with a simple tool for determining how much money you can rake in over different periods of time! One critical nit: The "Compute" button needs to be moved up to be just under the green data entry fields, since all the other fields are for output data - otherwise, the casual user might be tempted to enter data in the output data fields....
I'll be updating this post when the Carnival of the Capitalists arrives (hopefully) later today....
And later today it is!
Carnival of the Capitalists
This week's Carnival of the Capitalists is hosted by AnyLetter. The top posts this week include:
- Short Cut to Trouble
If you're launching a business, The Entrepreneurial Mind's Jeff Cornwall's post ought to do a lot to set you straight on your priorities in developing your business plan.
- Is Socialism Good for the Environment?
Brian Gongol reads socialists the environmental riot act.
- Gibson's Paradox
Proving that the Carnival of the Capitalists is where blog readers need to go to see the most interesting posts in the blogosphere, Mover Mike's contribution looks at how in the Greenspan era at the Federal Reserve, the gold standard may not have been as dead as we've been led to believe, which may be a real problem in the near future.
We all know how it works. Everyone knows that the oil companies are sticking to the little guy at the pump. Everyone knows that every time the price of a gallon of gas goes up by a penny, it goes straight to the bottom line of "Big Oil." We've all seen the headline where Exxon-Mobil just achieved the highest profit ever recorded for any U.S. company, and that profits are up *HUGE* at all the oil and refining companies. Heck, even U.S. Senator Arlen Specter has made statements to the effect that "'we intend to do something about' rising prices to the consumer," so it must all be true.
But is "Big Oil" really gouging consumers? How can we find out?
Probably the best way to find out is to look at a sample of big oil company earnings (profits) and compare it to their revenues (sales). The companies with the biggest proportion of profits to sales are the ones most likely to be gouging its consumers. The data for the fourth quarter of 2005 for a sampling of ten big oil companies is presented below, and is compared to the financial results of the same quarter in 2004. The data is presented in a dynamic table format, so you can click any of the column headings to sort the data in the table according to that particular statistic.
| Selected 2005 4th Quarter Oil Company Profits and Revenues |
|---|
| Company | 2005 Earnings (billion $USD) | 2005 Revenue (billion $USD) | 2005 Profit/ Revenue (%) | 2004 Profit (billion $USD) | 2004 Revenue (billion $USD) | 2004 Profit/ Revenue (%) |
|---|---|---|---|---|---|---|
| Amerada Hess | 0.45 | 7.15 | 6.3 | 0.23 | 4.70 | 4.9 |
| Burlington Resources | 0.93 | 2.37 | 39.1 | 0.40 | 1.56 | 25.6 |
| Chevron | 4.14 | 53.80 | 7.7 | 3.44 | 42.70 | 8.1 |
| ConocoPhillips | 3.68 | 52.20 | 7.0 | 2.43 | 40.10 | 6.1 |
| Exxon Mobil | 10.71 | 99.70 | 10.7 | 8.42 | 83.40 | 10.1 |
| Kerr-McGee | 0.13 | 1.76 | 7.1 | 0.13 | 1.39 | 9.6 |
| Marathon Oil | 1.27 | 17.31 | 7.3 | 0.43 | 14.31 | 3.0 |
| Sunoco | 0.30 | 9.27 | 3.2 | 0.18 | 7.42 | 2.4 |
| Tesoro | 0.07 | 4.36 | 1.6 | 0.00 | 3.39 | 0.0 |
| Valero Energy | 1.35 | 25.89 | 5.2 | 0.49 | 15.39 | 3.2 |
| Totals | 23.02 | 273.81 | 8.4 | 16.14 | 214.36 | 7.5 |
Note: The data in the table above is taken from a variety of recent news reports, and does not reflect one-time financial events (such as the sale of a business division), since these special events would significantly skew the data. Also, we should note that Burlington Resources is in the process of being acquired by ConocoPhillips.
So, the sharp increase in the price of oil from a year ago, has only resulted in profits rising with respect to company revenues by less than 1%, as the profits to sales ratio has increased from 7.5% to 8.4% (at least for this sampling of companies.)
Looking at conveniently available 2005 second quarter data, this increase would put the sampled companies in between the Materials sector (at the low end) and Real Estate (at the high end) among U.S. industries, ranking just ahead of the average of all U.S. industries.
By comparison, consider the profits to sales ratio of the banking sector where, in the second quarter of 2005, the ratio of profits to sales was nearly 20%. Other industries taking more in profits in proportion to their revenues that the sampled oil companies include: Food, Beverage and Tobacco, Telecommunications, Insurance, Consumer Services, Household and Personal Products, Diversified Financials, Semiconductors, Software Producers, and Pharmaceuticals.
It's plain that consumers are paying a lot more for gas at the pump. As for gouging though - it's just not there. Consumers would do well to talk to their bankers first....
Today, Political Calculations is revisiting our friends in the sky - this time, we're listening in to the things said between pilots and control towers around the world, including some very old but still very good ones!
Tower: "Delta 351, you have traffic at 10 o'clock, 6 miles!"
Delta 351: "Give us another hint! We have digital watches!"*****
Tower: "TWA 2341, for noise abatement turn right 45 Degrees."
TWA 2341: "Centre, we are at 35,000 feet. How much noise can we make up here?"
Tower: "Sir, have you ever heard the noise a 747 makes when it hits a 727?"*****
From an unknown aircraft waiting in a very long takeoff queue: "I'm f...ing bored!"
Ground Traffic Control: "Last aircraft transmitting, identify yourself immediately!"
Unknown aircraft: "I said I was f...ing bored, not f...ing stupid!"*****
O'Hare Approach Control to a 747: "United 329 heavy, your traffic is a Fokker, one o'clock, three miles, Eastbound."
United 239: "Approach, I've always wanted to say this... I've got the little Fokker in sight."*****
A student became lost during a solo cross-country flight. While attempting to locate the aircraft on radar, ATC asked, "What was your last known position?" Student: "When I was number one for takeoff."
*****
A DC-10 had come in a little hot and thus had an exceedingly long roll out after touching down. San Jose Tower Noted: "American 751, make a hard right turn at the end of the runway, if you are able. If you are not able, take the Guadalupe exit off Highway 101, make a right at the lights and return to the airport."
*****
There's a story about the military pilot calling for a priority landing because his single-engine jet fighter was running "a bit peaked."
Air Traffic Control told the fighter jock that he was number two, behind a B-52 that had one engine shut down.
"Ah," the fighter pilot remarked, "The dreaded seven-engine approach."
*****
A Pan Am 727 flight waiting for start clearance in Munich overheard the following:
Lufthansa (in German): "Ground, what is our start clearance time?"
Ground (in English): "If you want an answer you must speak in English."
Lufthansa (in English): "I am a German, flying a German airplane, in Germany. Why must I speak English?"
Unknown voice from another plane (in a beautiful British accent): "Because you lost the bloody war."*****
Tower: "Eastern 702, cleared for takeoff, contact Departure on frequency 124.7"
Eastern 702: "Tower, Eastern 702 switching to Departure. By the way, after we lifted off we saw some kind of dead animal on the far end of the runway."
Tower: "Continental 635, cleared for takeoff behind Eastern 702, contact Departure on frequency 124.7. Did you copy that report from Eastern 702?"
Continental 635: "Continental 635, cleared for takeoff, roger; and yes, we copied Eastern... we've already notified our caterers."*****
One day the pilot of a Cherokee 180 was told by the tower to hold short of the active runway while a DC-8 landed. The DC-8 landed, rolled out, turned around, and taxied back past the Cherokee. Some quick-witted comedian in the DC-8 crew got on the radio and said, "What a cute little plane. Did you make it all by yourself?" The Cherokee pilot, not about to let the insult go by, came back with a real zinger: "I made it out of DC-8 parts. Another landing like yours and I'll have enough parts for another one."
*****
The German air controllers at Frankfurt Airport are renowned as a short-tempered lot. They not only expect one to know one's gate parking location, but how to get there without any assistance from them. So it was with some amusement that we (a Pan Am 747) listened to the following exchange between Frankfurt ground control and a British Airways 747, call sign Speedbird 206.
Speedbird 206: "Frankfurt, Speedbird 206 clear of active runway."
Ground: "Speedbird 206. Taxi to gate Alpha One-Seven."The BA 747 pulled onto the main taxiway and slowed to a stop.
Ground: "Speedbird, do you not know where you are going?"
Speedbird 206: "Stand by, Ground, I'm looking up our gate location now."
Ground (with quite arrogant impatience): "Speedbird 206, have you not been to Frankfurt before?"
Speedbird 206 (coolly): "Yes, twice in 1944, but it was dark, -- and I didn't land."*****
While taxiing at London's Gatwick Airport, the crew of a US Air flight departing for Ft. Lauderdale made a wrong turn and came nose to nose with a United 727. An irate female ground controller lashed out at the US Air crew, screaming: "US Air 2771, where the hell are you going?! I told you to turn right onto Charlie taxiway! You turned right on Delta! Stop right there. I know it's difficult for you to tell the difference between C and D, but get it right!"
Continuing her rage to the embarrassed crew, she was now shouting hysterically: "God! Now you've screwed everything up! It'll take forever to sort this out! You stay right there and don't move till I tell you to! You can expect progressive taxi instructions in about half an hour and I want you to go exactly where I tell you, when I tell you, and how I tell you! You got that, US Air 2771?"
"Yes, ma'am," the humbled crew responded.
Naturally, the ground control communications frequency fell terribly silent after the verbal bashing of US Air 2771. Nobody wanted to chance engaging the irate ground controller in her current state of mind. Tension in every cockpit out around Gatwick was definitely running high. Just then an unknown pilot broke the silence and keyed his microphone, asking: "Wasn't I married to you once?"
Labels: none really
Eugene Volokh recently took a college newspaper to task for its poor handling of numerical data that, if the reporters and editors had been more numerically literate, would have saved them the embarrassment of discovering that the numbers they published in connection with the number of rapes occurring in the U.S. were highly unrealistic.
That's why Political Calculations(TM) is proud to offer the following tool, which takes a number and a corresponding period of time, and does all the math needed to figure out what the corresponding statistic would be for other periods of time!
While this tool won't help the typical college journalist (or for that matter, a professional one) realize what a realistic number might be, at least now, they don't have any excuses for not getting the math right....
Welcome to the blogosphere's toolchest! Here, unlike other blogs dedicated to analyzing current events, we create easy-to-use, simple tools to do the math related to them so you can get in on the action too! If you would like to learn more about these tools, or if you would like to contribute ideas to develop for this blog, please e-mail us at:
ironman at politicalcalculations
Thanks in advance!
Closing values for previous trading day.
This site is primarily powered by:
CSS Validation

RSS Site Feed
JavaScript
The tools on this site are built using JavaScript. If you would like to learn more, one of the best free resources on the web is available at W3Schools.com.
Other Cool Resources
Blog Roll


