The probability the U.S. economy will see a recession begin sometime in the next twelve months has started to fall again during the past six weeks. after having hit a double-top.
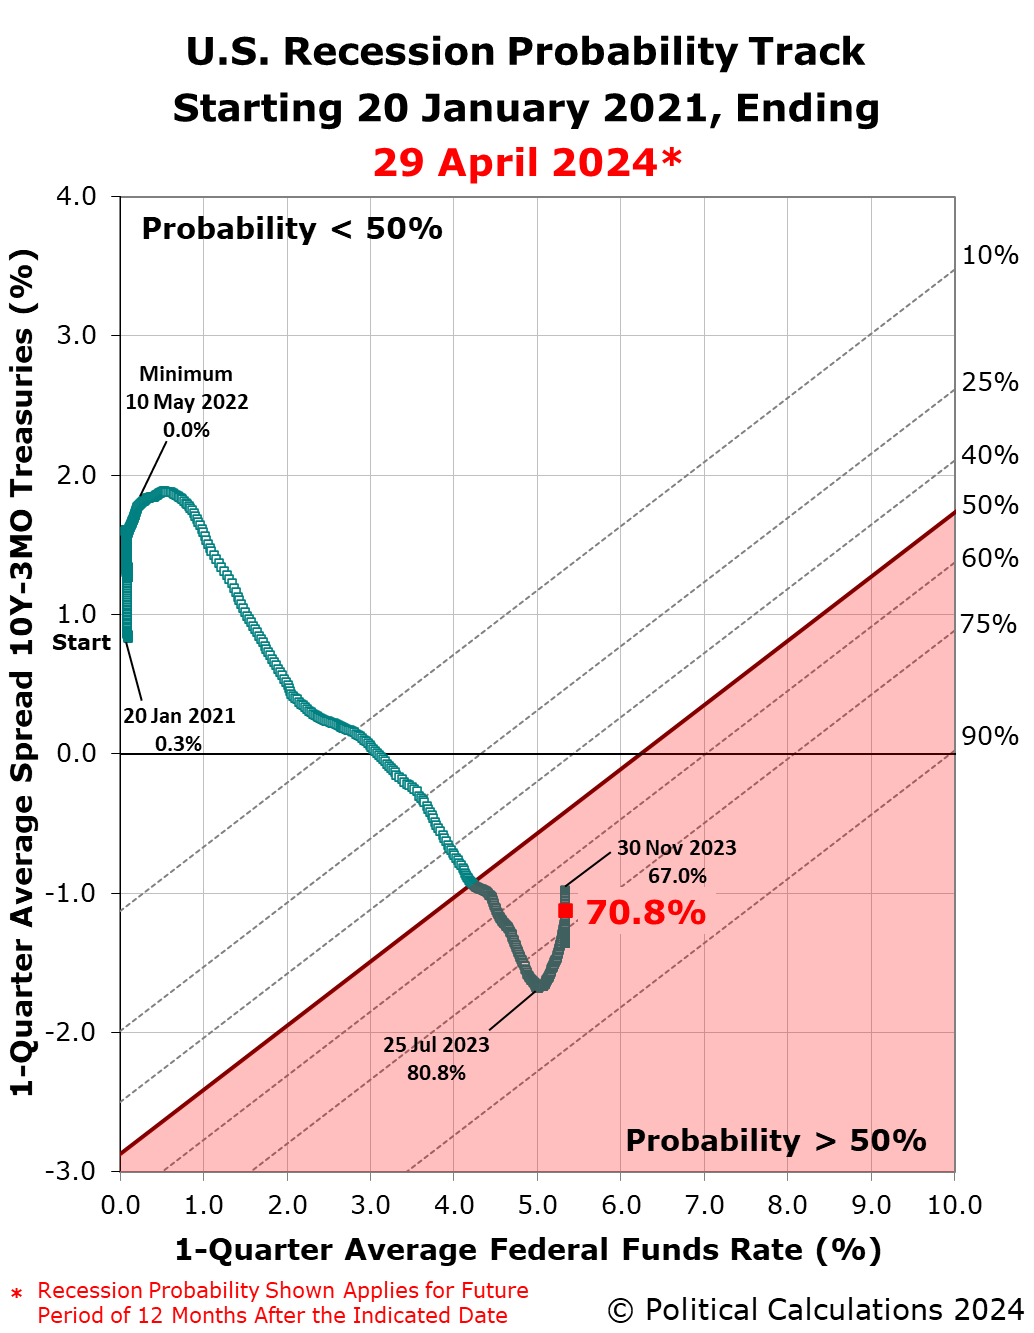
Since our previous update, the probability has dropped from over 76% to just under 71%, confirming the double-top after having previously peaked at 81% in July 2023.
These probabilities are determined using a recession forecasting method developed for the Federal Reserve Board in 2006. They represent a portion of the economic data and forecasts Federal Reserve officials will consider as they meet from 30 April to 1 May 2024 to review how they will set the level of short term interest rates in the United States in the months ahead. The expected timing of rate cuts by the Fed has been slipping later and later during the past six weeks.
The following chart presents the latest update of the Recession Probability Track. It reveals how that probability appears as the Federal Reserve's Open Market Committee (FOMC) goes into its April 2024 meetings to review and potentially change the Federal Funds Rate (FFR). The FOMC is expected to continue holding the FFR steady at this meeting, but is expected to start lowering this core interest rate at later meetings in 2024. Markets anticipate the Fed may cut this interest rate at its September 2024 meeting.
The Recession Probability Track indicates the probability a recession will someday be officially determined to have begun sometime in the next 12 months. For this update, that applies to the dates between 29 April 2024 and 29 April 2025.
The double-top pattern we've described at the beginning of this article can be better seen by simply tracking the recession probability over time. The next chart shows that forecast probability using the data available from 30 April 1983 through 29 April 2024, with the probabilities shown shifted 12 months into the future to coincide with the end of the period in which they apply.
The probability of recession peaked at nearly 81% on 25 July 2023, making the period from July 2023 through July 2024 the mostly likely period in which the National Bureau of Economic Research will someday identify a point of time marking the peak in the U.S. business cycle before it entered a period of contraction. The prolonged elevation of the Federal Funds Rate combined the deepened inversion of the U.S. Treasury yield curve in recent weeks has made the period between 18 March 2024 and 18 March 2025 the second most-likely period that will include the peak of a business cycle that marks when a recession began.
Another way to interpret the double-top pattern is to consider that it extends the period in which the highest probability of recession is elevated. Under that interpretation, the period in which the probability of an official recession starting would be greater than 70% is running from 25 July 2023 through at least 29 April 2025.
Only time will tell if that's an appropriate way to interpret the data. Looking at the underlying data that's used to determine the recession probability, we anticipate it will continue falling in the near term, making a "triple-top" event unlikely.
Analyst's Notes
The Recession Probability Track is based on Jonathan Wright's yield curve-based recession forecasting model, which factors in the one-quarter average spread between the 10-year and 3-month constant maturity U.S. Treasuries and the corresponding one-quarter average level of the Federal Funds Rate. If you'd like to do that math using the latest data available to anticipate where the Recession Probability Track is heading, we have provided a tool to make it easy to do.
We will continue following the Federal Reserve's Open Market Committee's meeting schedule in providing updates for the Recession Probability Track until the U.S. Treasury yield curve is no longer inverted and the future recession odds retreat below a 20% threshold. We're curious to see how this forecasting method performs.
For the latest updates of the U.S. Recession Probability Track, follow this link!
Previously on Political Calculations
We started this new recession watch series on 18 October 2022, coinciding with the inversion of the 10-Year and 3-Month constant maturity U.S. Treasuries. Here are all the posts-to-date on that topic in reverse chronological order, including this one....
- Recession Probability Falls After Hitting Double-Top
- U.S. Recession Probability Nears a Double-Top
- Probability of U.S. Recession Resurges to Nearly 75%
- U.S. Recession Odds Recede to Two Out of Three Chance in 2024
- U.S. Recession Probability Continues Receding on All Hallow's Eve
- U.S. Recession Probability Starts to Recede
- Probability of Recession Starting in Next 12 Months Breaches 80%
- U.S. Recession Probability on Track to Rise Past 80%
- U.S. Recession Probability Reaches 67%
- U.S. Recession Probability Shoots Over 50% on Way to 60%
- Recession Probability Nearing 50%
- Recession Probability Ratchets Up to Better Than 1-in-6
- U.S. Recession Odds Rise Above 1-in-10
- The Return of the Recession Probability Track
Image Credit: Microsoft Copilot Designer. Prompt: "A signpost with the words 'Recession Ahead?'"
Labels: recession forecast
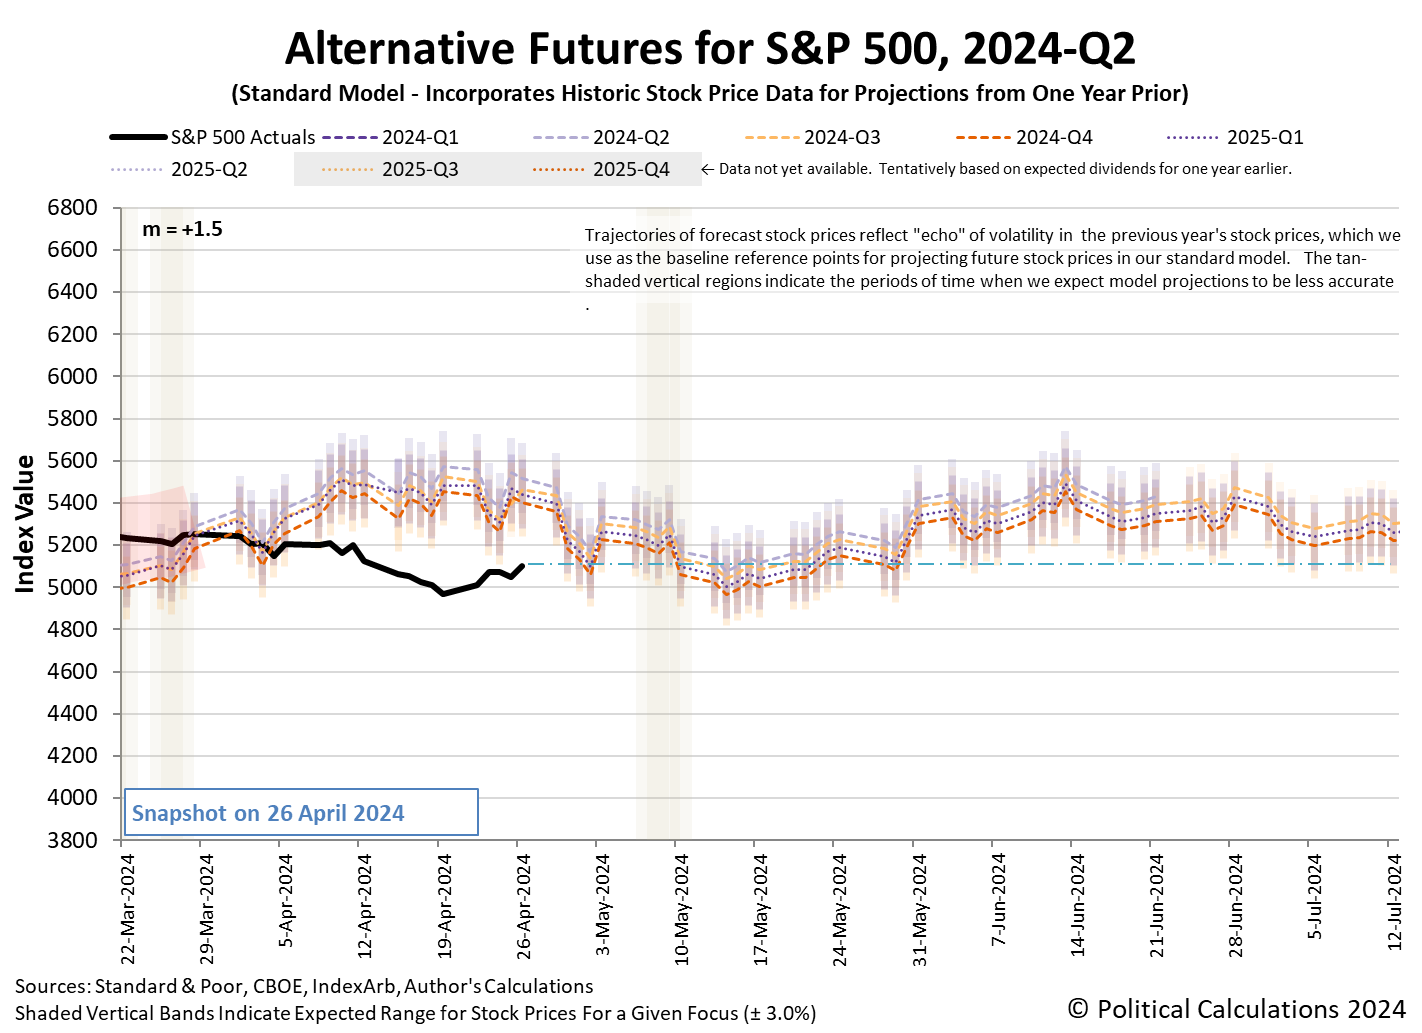
It was a good week for the S&P 500 (Index: SPX) jumped almost 2.7% over the previous week. The index closed the fourth week of April 2024 at 5,099.96.
There were three main drivers behind the positive change from the preceding week:
- The world's biggest publicly-traded company Microsoft (NASDAQ: MSFT) experienced what one analyst called a "drop the mic moment", as its cloud computing division and especially its artificial intelligence (AI) initiatives boosted its bottom line.
- Alphabet (NASDAQ: GOOG and GOOGL) also reported booming earnings and announced it would initiate a dividend to shareholders of its stocks. The company's market cap surged above $2 trillion on that news.
- The expected timing for when the Fed will cut interest rates stopped slipping. The CME Group's FedWatch Tool held steady in anticipating the Fed will hold the Federal Funds Rate steady in a target range of 5.25-5.50% until 18 September (2024-Q3), the same as expected a week earlier, but now looking much less shaky. The tool projects the Fed will cut the rate by 0.25% on that date, which is now expected to hold at its new level for the next six months.
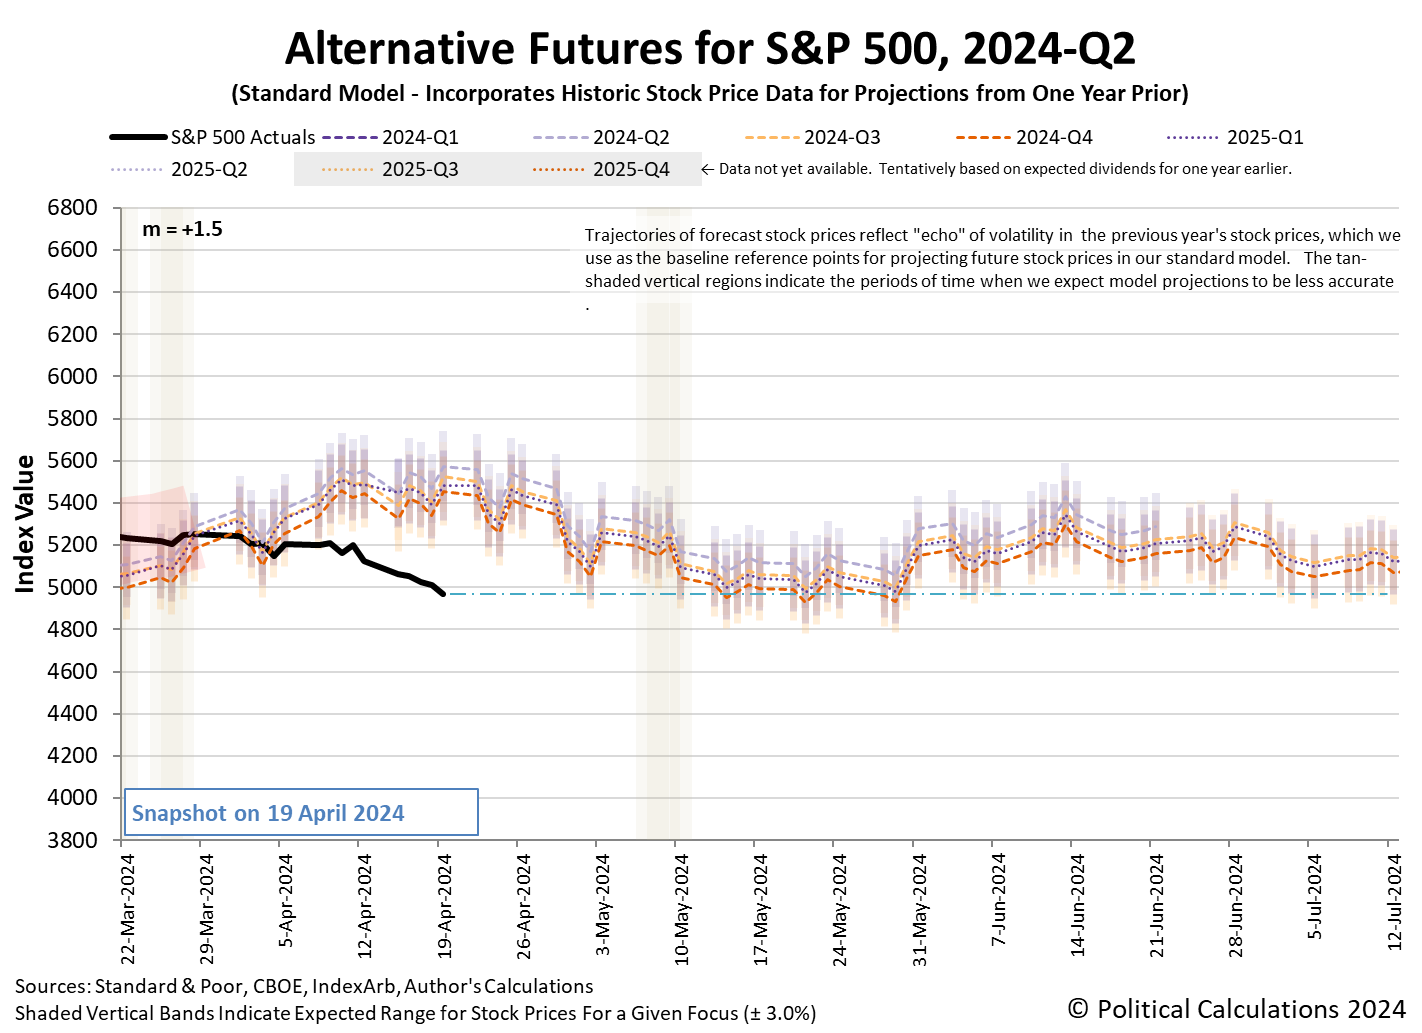
We think that last development to prompted investors to shift their forward investment horizon from 2024-Q4 back toward 2024-Q3. Here's the latest update of the alternate futures chart.
Here are the week's other market-moving news headlines:
- Monday, 22 April 2024
-
- Signs and portents for the U.S. economy:
- IMF's Gopinath says high U.S. deficits fueling growth, higher interest rates
- US consumers on lower incomes face loan stress while banks pull back
- Fed minions feel "no urgency" going into pre-FOMC meeting blackout period:
- Bigger trouble developing in China as tax cut stimulus takes effect:
- Souring China dreams force Western financial firms to cut costs
- China's state planner warns intensified EV price war on oversupply
- China's Q1 fiscal revenue falls as tax cut policies weigh
- BOJ minions thinking about hiking rates, propping up yen:
- ECB minions excited about cutting rates in June 2024, getting tired of following Fed's lead:
- Middle East tensions should not delay ECB's June rate cut, Villeroy says
- ECB governors fear political pressure over Fed-style 'dot plot'
- Nasdaq, S&P, and Dow closed on top as earnings season rolls on
- Tuesday, 23 April 2024
-
- Signs and portents for the U.S. economy:
- US business activity cools in April; inflation measures mixed
- Oil falls back after robust EU data as Mideast tensions linger
- Shortages key to copper's upward price trajectory to new peaks
- US new home sales rebound to six-month high; rising mortgage rates a concern
- BOJ minions say they'll hike interest rates if inflation rises above their target, preparing to prop up yen:
- BOJ will hike rates if trend inflation accelerates, gov Ueda says
- Yen's slide toward 160 level could trigger action, says senior ruling party official
- Japan may intervene to support yen any time, says senior ruling party official
- Japan issues strongest warning yet on readiness to intervene in currency market
- ECB minions thinking about cutting rates to prop up Eurozone economy:
- ECB governors stick to plan for multiple rate cuts despite global headwinds
- June ECB rate cut firmly in play; but slower easing now expected
- Nasdaq, S&P, Dow rise as Wall Street rebounds for a second straight day; Tesla reports
- Wednesday, 24 April 2024
-
- Signs and portents for the U.S. economy:
- Slow, but solid US economic growth anticipated in Q1; inflation likely heats up
- Oil settles lower as U.S. business activity cools, concerns over Middle East ease
- Bigger bailouts developing in China:
- Country Garden allowed to postpone first payments on three onshore bonds
- Exclusive: China turns the heat up on cross-border investments in local govt debt, sources say
- BOJ minions thinking more about how and when to prop up yen:
- ECB minions thinking about what to do after they start cutting rates:
- Nasdaq, S&P, Dow end little changed amid Tesla surge, industrials slump & rise in yields
- Thursday, 25 April 2024
-
- Signs and portents for the U.S. economy:
- Q1 US GDP shows surprise slowing and uncomfortable inflation
- Oil eases as US demand concerns outweigh Middle East fears
- Fed minions whinging over mixed signals sent by U.S. economic data:
- Confounding US economic, inflation data muddy Fed's rate path
- Weak GDP, strong prices, highlight Fed dilemma
- BOJ minions getting more worried about falling yen, thinking they may have to do something about it:
- ECB minions worry about inflation, Eurozone government officials want to make ECB minions worry about more than that:
- ECB most concerned about wages, services, Schnabel says
- ECB should not only target inflation, Macron says
- Nasdaq, S&P, Dow dip after GDP print fans stagflation worries; Meta plunges post earnings
- Friday, 26 April 2024
-
- Signs and portents for the U.S. economy:
- Fed minions still expected to deliver rate cut in September 2024:
- BOJ minions do nothing to change interest rates to combat inflation or to prop up Japan's currency:
- BOJ keeps low rates, hints of future rate hikes fail to stem yen fall
- Japan frets over relentless yen slide as BOJ keeps ultra-low rates
- Microsoft, Alphabet gains propel Nasdaq to best day since Feb; S&P, Dow also rise
The U.S. Bureau of Economic Analysis' first estimate of the real GDP growth rate in 2024-Q1 is +1.6%, well below the +2.9% growth rate forecast by the Atlanta Fed's GDPNow toola week ago. The BEA will revise its GDP growth rate estimate twice during the next two months. In the meantime, the Atlanta Fed's GDPNow tool has turned its forward-looking focus to how fast real GDP will grow during 2024-Q2 with an initial forecast of +3.9% growth for the quarter.
Image credit: Microsoft Copilot Designer. Prompt: "An editorial cartoon of a jumping bull wearing a sign"
Choosing the right adjective can be a challenge. For example, let's say you want to precisely describe how good you think something is. Sure, you could just say "It's good", but what if the thing you're describing is better than that?
Perhaps it's "quite good". Or "really good". Maybe it's even "very good", but is that better than something that's really good?
What if it's "awesome"? Is something that's awesome better than something that's very good? Not knowing whether it is or not can lead to some really "mediocre" if not "rubbish" attempts to communicate on your part.
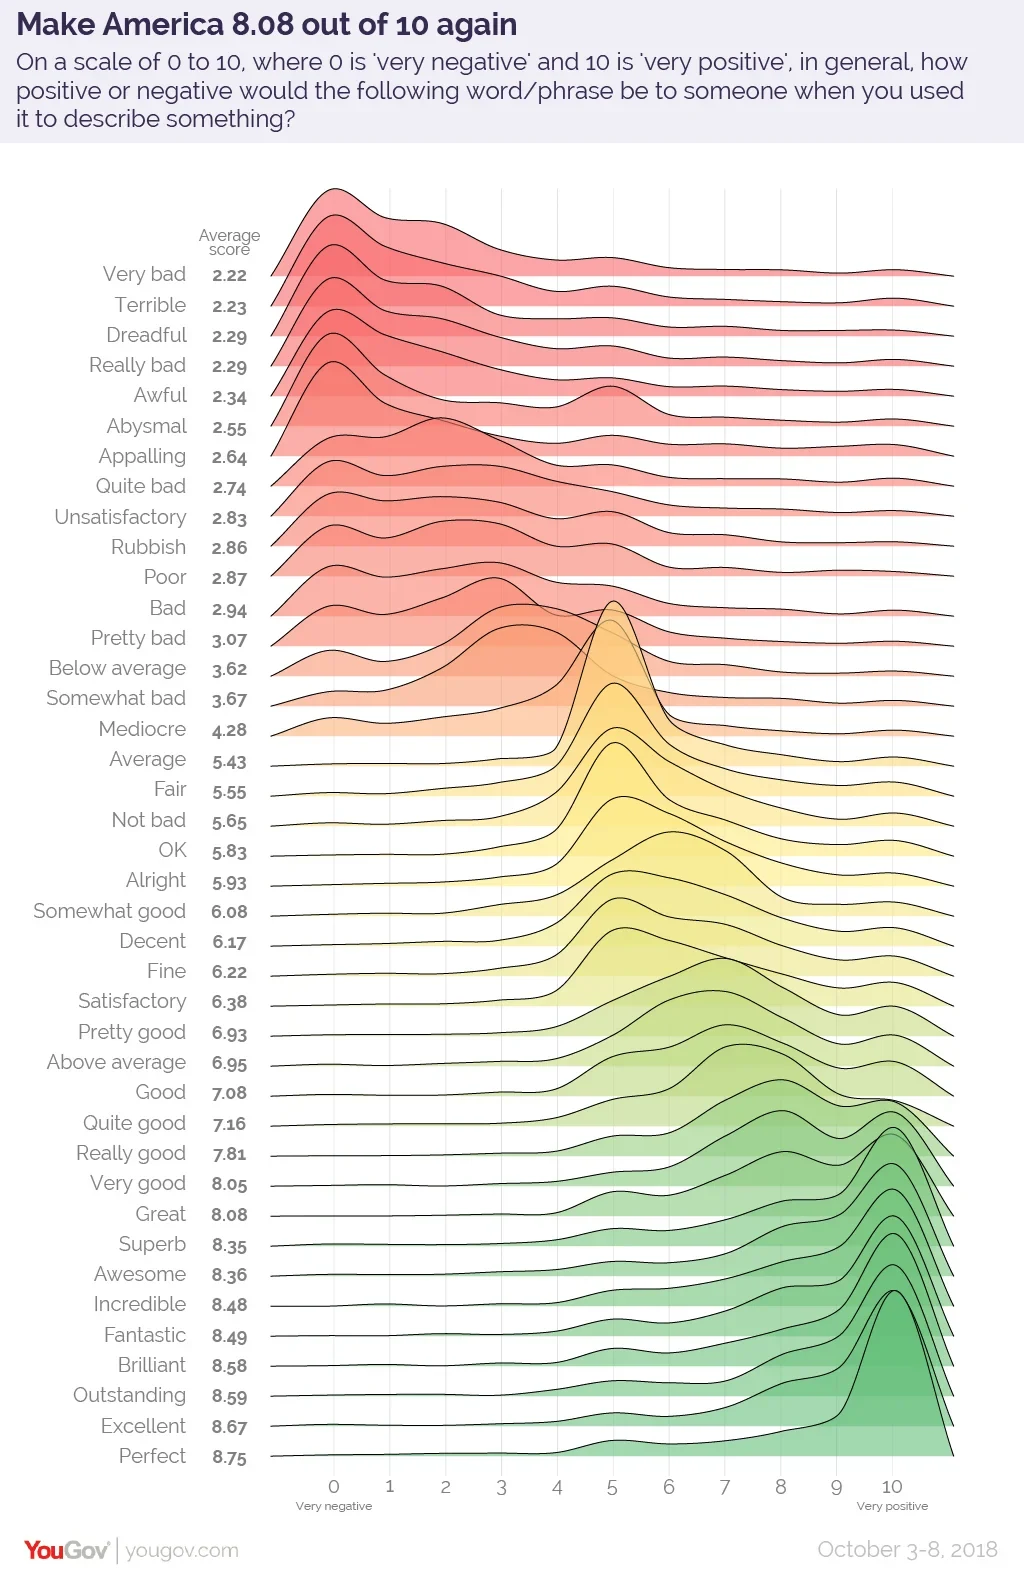
Fortunately, YouGov ran a poll back in 2018 to assign a score to the common English words and phrases Americans frequently use to describe how either positive or negative they think something is. The results are graphically depicted in the following chart, which can be used as a tool to precisely dial your description of how good something is by choosing the right adjective to convey what you really think about it:
Now, when you describe something as "decent", it's because you mean it's better than "alright", but isn't quite as good as something you think is "fine". Isn't that "fantastic", which you now know is just a tick better than "incredible"?
Labels: data visualization
Computing technology continues to increase in capability every year. For hackers with top-of-the-line equipment, it is easier than ever for them to run through millions of combinations of characters to discover your passwords than ever before.
But how long that might take them still depends on how many characters long it is and what combinations of numbers, lower case letters, upper case letters, and special characters you use in your password.
Hive Systems has updated their "Time It Takes a Hacker to Brute Force Your Password" infographic for 2024. Here is the table:
Hive Systems' Corey Neskey's offers a discussion of how they determined the amount of time it would take a hacker to discover your password by trying all possible combinations of different sets of characters.
And for the record, if any of your passwords have been exposed to hackers through a data breach, the amount of time it takes a hacker to get into your account using that password is described as "instantly". Or in other words, it's time for you to change those breached passwords to something much longer with many more kinds of characters.
Labels: data visualization
Here's a problem from real life in early 2024. Let's say you're thinking about taking the plunge and getting an electric-powered vehicle. Whether it's because you want to be seen as someone who cares about the environment or it's because you really like the idea of having the power of instantaneous torque when you step on the accelerator, getting an EV is something you've decided to do.
But because the technology is changing so quickly and because electric vehicle prices are falling, you don't want to lock yourself into owning an electric vehicle. You're looking to lease one for a few years instead.
Sound plausible so far? Okay, let's get really specific. Let's say you've narrowed your options and are thinking about leasing a $38,990 Tesla Model 3, which has a down payment of $2,999. The lease payment is $299 a month for three years, and at the end of the lease term the car’s market value is projected to be about 67% of its original value. What is the effective interest rate you'll pay for this leasing deal?
That's not so easy a question to answer because even if you have the right formula to plug all these numbers into, because there's no straightforward way to rearrange that equation to simply solve it for the interest rate. You'll either have to use trial and error to get to that answer or you'll need to apply some advanced math and run through a series of calculations to get to a precise approximation.
Unless you're willing to trade a little accuracy to get to a still reasonably accurate result. There is a relatively simple equation that can calculate an approximate value for the interest rate, which we've built the following tool to do. If you've accessing this article on a site that republishes our RSS news feed, please click through to our site to access a working version of the tool.
The result of the tool should give you a reasonable estimate of the effective interest rate you're paying to take out this lease. For the default values in our leasing scenario, that result is 5.73%.
But if you have other numbers, by all means, take the tool for a test drive with them! And if you can get the actual lease interest rate, compare your results to see how close the approximation behind this got to the exact result!
Image credit: Tesla Model 3 (2023) by Kazyakurumaon Wikimedia Commons. Creative Commons CCO 1.0 DEED CC0 1.0 Universal .
Labels: personal finance, tool
Later this week, on Thursday, 25 April 2024, the Bureau of Economic Analysis will publish its first estimate of the United States' Gross Domestic Product during the first quarter of 2024.
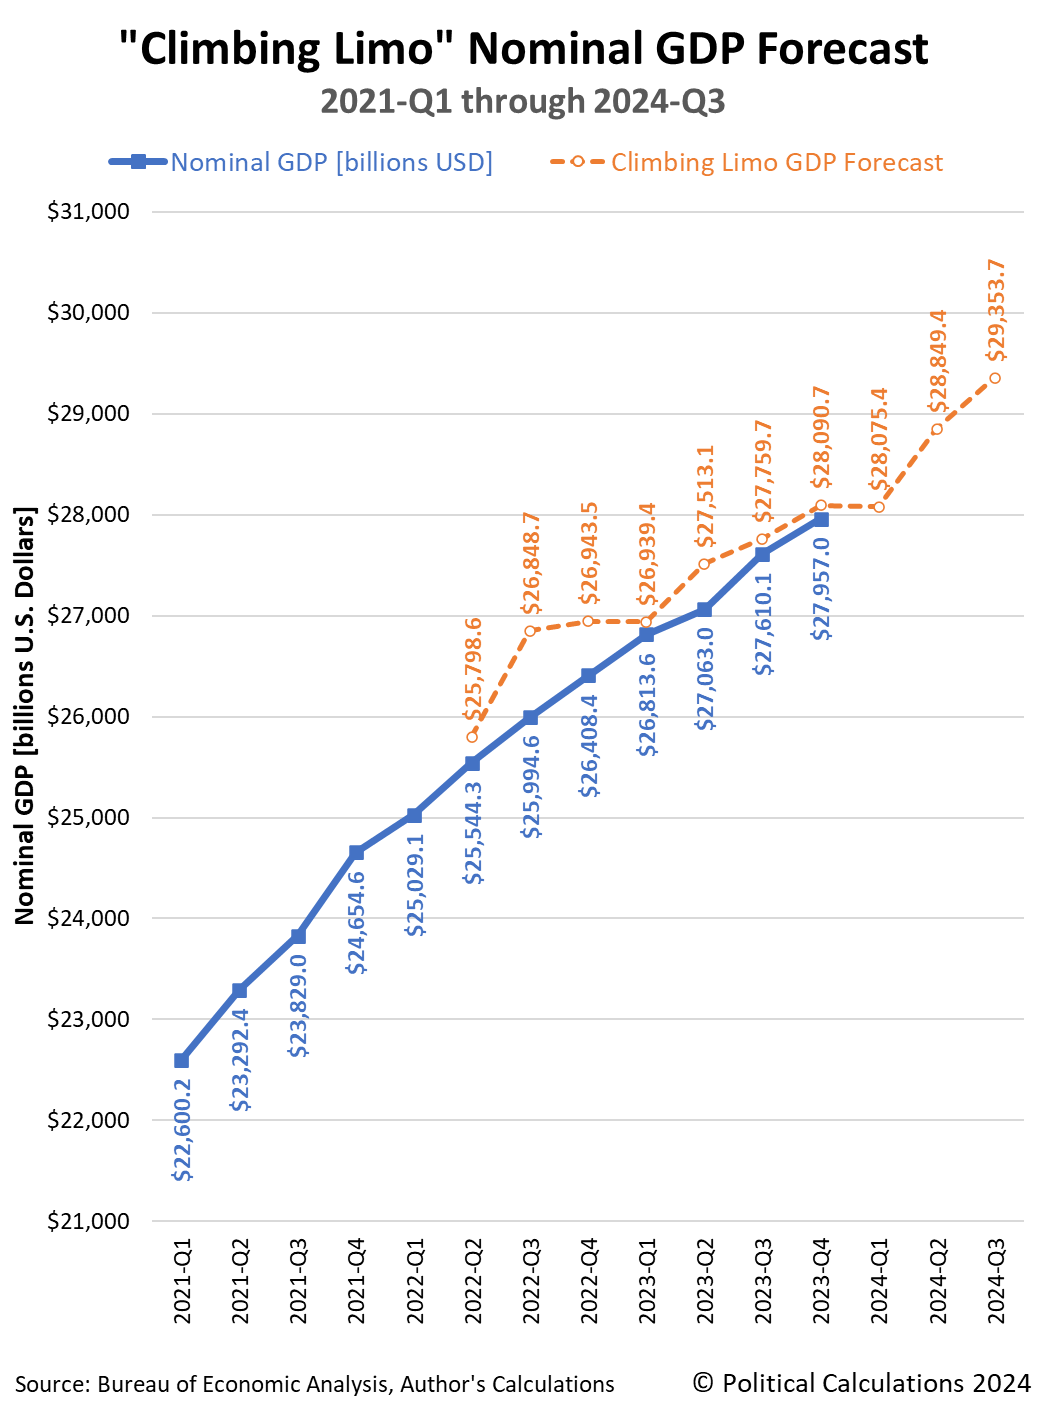
Because that date is so close, it's a good opportunity to check in with how 2024-Q1's GDP tracks with what a momentum-based forecasting method projected it would be for this quarter over seven months ago. That simple method, called the "Climbing Limo", uses nominal GDP data that was available back in September 2023 in its projections.
The following chart reveals how closely that method worked for anticipating the final GDP estimate for the fourth quarter of 2023 (2023-Q4), which only became available last month. As you can see, there's only a half-percent difference between the forecast for 2023-Q4's nominal GDP and the BEA's official estimate for the quarter.
If the Atlanta Fed's GDPNow forecast for 2024-Q1 is right, this quarter could be the first in which actual GDP exceeds the climbing limo's momentum-based forecast in the period covered by the chart.
Which means nearly nothing. That's because when economic growth is relatively stable, it's common for forecast and actual GDP data series to periodically cross over each other just based on variation in the data. For the period shown on the chart, which presents the Climbing Limo forecast using only the actual GDP data shown on the chart, it has been unusual for actual GDP to have so consistently underperformed the momentum-based forecast.
That could be because inflation, which is built into the nominal GDP estimates, has been slowing over this period. But there are other potential explanations that could account for that pattern as well, including slowing momentum in the U.S. economy after the initial phase of the post-Coronavirus Recession recovery.
Regardless, it will be another two months before we get the BEA's final GDP estimate for the first quarter of 2024 to see how good the Climbing Limo's forecast for 2024-Q1 turned out to be.
Looking much further forward, since the GDP data for 2023-Q4 has been finalized, the Climbing Limo method projection using that data point suggests some rather robust GDP growth through the third quarter of 2024. Unfortunately, it will be months before we find out how good that forecast is. As a general rule of thumb, it's usually within a few percentage points of the actual GDP estimate, but that can change if the economy turns a proverbial corner, either for the better or for the worse. In either of these cases, a comparison with the Climbing Limo forecast provides a useful confirmation of which situation applies.
Update 25 April 2025
The BEA issued its first estimate of nominal GDP for 2024-Q1: $28,284.5 billion. That figure is 0.7% higher than the seven-month old climbing limo forecast of $28,075.4 billion, so reported GDP has crossed above the climbing limo projection. The BEA will finalize its GDP estimate for the quarter, at least outside of its annual revisions, at the end of June 2024. Most news reporting is focusing on the inflation-adjusted "real" GDP figures coming in lower than had been forecast. The first estimate of the real growth rate for 2024-Q1 is 1.6%, the Atlanta Fed's GDPNow forecast tool had antipated 2.7% growth as recently as 24 April 2024.
References
U.S. Bureau of Economic Analysis. National Income and Product Accounts. Table 1.1.5. Gross Domestic Product. [Online Database]. Accessed 21 April 2024.
Political Calculations. Forecasting GDP Using the Climbing Limo. [Online Tool]. 10 May 2005.
Image Credit: Microsoft Copilot Designer. Prompt: "A limousine with the letters 'GDP' driving upward to the top of a hill on a very rocky road, with the limousine driving on the rocks".
Labels: gdp forecast
The S&P 500 (Index: SPX) fell again durin ghte third week of April 2024. The index closed out the week at 4,967.23, a little over three percent below the level it closed the second week. The index has dropped 5.5% below its record peak closing value from 28 March 2024.
The main driving force behind the falling level of stock prices are slipping expectations for when and by how much the Federal Reserve will cut interest rates during 2024. The CME Group's FedWatch Tool anticipates the Fed will hold the Federal Funds Rate steady in a target range of 5.25-5.50% until 18 September (2024-Q3) when a quarter point reduction is expected, some twelve weeks longer than expected just a week earlier. The tool also projects only one rate cut in 2024, the timing of which is looking uncertain.
As we illustrated in a separate analysis, that slipping timing is reducing the expected level of dividends in future quarters. Right now, we think investors have been scared by the "no rate cut" bear into shifting their forward-looking focus to either 2024-Q3 or 2024-Q4, with their investment time horizon being affected by the sliding expectations for when the Fed might alter the level of short term interest rates in the U.S.
We're basing that hypothesis on the level the dividend futures-based model is projecting the potential level of the S&P 500 will be a month from now as we're within the month-long window in which its projections have "locked in". The latest update for the alternative futures chart shows the current level of the index is consistent with the model's still-dynamic projections outside of the locked-in period:
An alternate explanation is the stock market is experiencing a regime change, in which the dividend futures-based model's basic multiplier has changed, but we would need several more weeks of data to confirm if that is the case. We're weighing these scenarios behind the scenes, where we haven't yet seen sufficient data to determine the established value of the multiplier has definitively broken from the level it has held since 9 March 2023.
In the meantime, the context provided by the market-moving headlines of the week points to that market regime still holding. The week's headlines point to the rapidly slipping expected timing of rate cuts in 2024, which continued in the past week, as the continuing culprit in the decline of stock prices during the last several weeks.
- Monday, 15 April 2024
-
- Signs and portents for the U.S. economy:
- US growth may be a global boon, but inflation could derail the train
- Oil slips as risk premium eases after Iran attack
- Fed minions say they won't rush to cut rates until they need to see data pointing to wage inflation:
- Fed should not act urgently to cut rates unless required, Daly says
- US workers seeking record wages to consider new jobs, New York Fed says
- Fed's reverse repo facility plummets to lowest level in nearly three years
- Bigger trouble, stimulus developing in China:
- China's Q1 GDP growth likely to slow, more stimulus on the cards
- China c.bank keeps policy rate unchanged, drains cash from banking system
- Economic growth signs in Japan:
- Nasdaq, S&P, and Dow ended notably lower while yields rallied once again
- Tuesday, 16 April 2024
-
- Signs and portents for the U.S. economy:
- US single-family housing starts plunge in March
- Oil slips as concern eases about Middle East supply risk
- US manufacturing output increases in March; February data revised higher
- In reversal, Fed minions claim they need more time to combat inflation before they can cut rates:
- Federal Reserve's restrictive policy needs more time to work, Jerome Powell says
- Fed could keep monetary policy tight for longer if needed, Jefferson says
- Bigger trouble, stimulus developing in China as Q1 growth better than expected:
- China's Q1 GDP grows 5.3% y/y, well above forecast
- China's cycle of dollar hoarding and weakening yuan gets vicious
- China's new home prices decline at fastest pace since 2015
- Chinese city Zhengzhou tells state-owned company to buy second-hand homes to reduce new housing inventories
- Nasdaq, S&P, Dow end mixed after hawkish Powell further clouds rate cut expectations
- Wednesday, 17 April 2024
-
- Signs and portents for the U.S. economy:
- US regional banks seen booking more commercial property losses, loan sales
- Oil dips as demand worries outweigh Middle East supply risks
- US wheat farmers face bleak crop economics as grain oversupply hits
- Fed minions say they're in "no hurry" to cut interest rates:
- Bigger trouble, stimulus developing in China:
- ECB minions looking forward to cutting Eurozone interest rates, don't want to review their inflation target anytime soon:
- ECB firmly behind June rate cut but views diverge on July
- ECB's Vasle sees rates much closer to 3% at year-end
- ECB's Centeno says policy would be tight even after two rate cuts
- ECB's Lagarde hints it is too early to review inflation target
- Nasdaq sheds more than 1%, S&P posts four-day losing streak, Dow slips slightly
- Thursday, 18 April 2024
-
- Signs and portents for the U.S. economy:
- Oil extends losses on easing Middle East tension, demand concerns
- Mortgage rates top 7% for the first time this year, Freddie Mac says
- Fed minions now saying they're in no "mad dash hurry" to cut interest rates:
- Fed's Bostic says he is not in a 'mad dash hurry' on rate cuts
- Fed's Williams doesn't see urgent need to cut interest rates
- BOJ minions promise future rate hikes will be slow:
- BOJ's Noguchi says future rate hikes likely to be slow
- BOJ's Ueda signals possible rate hike if weak yen boosts inflation
- ECB minions say they're "crystal clear" on cutting Eurozone interest rates in June:
- ECB 'crystal clear' on June rate cut, de Guindos says
- German home building permits tumble 18% in February, extending rout
- S&P posts five-day loss for first time since Oct, Nasdaq & Dow end mixed; eyes on Netflix
- Friday, 19 April 2024
-
- Signs and portents for the U.S. economy:
- Oil settles slightly higher as Iran plays down reported Israeli attack
- Fed says 1,804 banks and other institutions tapped emergency lending facility
- IMF minions getting mad at Fed minions; Fed minions say they're doing nothing because Bidenflation not going away:
- Fed's rate-cut foot-dragging grates on global peers at IMF meetings
- Fed policy on hold because of 'stalled' progress on inflation, Goolsbee says
- Bigger trouble, stimulus developing in China:
- BOJ minions say rate hikes are coming:
- ECB minions say inflation could go either way:
- Wall Street's April pullback intensifies as S&P 500 notches worst week in over a year
The Atlanta Fed's GDPNow tool's latest estimate of real GDP growth for the first quarter of 2024 (2024-Q1) rose to +2.9% from the +2.4% growth forecast last week.
Image credit: Microsoft Bing Image Creator. Prompt: "An editorial cartoon of a bear with a sign that says 'NO RATE CUTS' scaring Wall Street traders"
What happens when you embed a miniature flying drone inside a ball? Or more precisely, when you mount a lightweight miniature drone inside a ball-shaped frame that allows air to pass through so the drone's rotors can work?
What you get is a bit of modern magic that lets you play catch with yourself. Meet the Flying Orb Ball Hover Toy, or "the boomerang ball", the concept of which is demonstrated in the following short video (HT: Core77):
Versions of this technological wonder are available at retailers like Amazon and Walmart. And like many modern tech-based toys, it has a rechargeable battery.
That brings us to the downside of this new technology. It takes 25 minutes to charge up one of these flying orbs to get about 10 minutes of play time from it. So for you and your kids to get maximum entertainment from these devices, you would have to buy several, as we suspect their makers and retailers are hoping you might.
If you take that plunge, you might also think about getting one of those ball bags that baseball umpires use, which of course, are sold separately.
Labels: technology
Nearly four weeks ago, we put down a marker for what lay ahead for the S&P 500 based on the index' quarterly dividend futures.
Looking beyond 2024-Q2, you'll see something unusual. There's projected drop-off in quarterly dividends between 2024-Q2 and 2024-Q3. It's unusual because we would ordinarily expect to see the third quarter's anticipated dividends fall in between the projected values for the second and fourth quarters. And since the outlook for the index' dividends in all quarters has been improving, we would have at least expected to see it close the gap between the second and fourth quarter's values.
But it hasn't. If anything, the projected drop-off in the dividends expected to be paid from 2024-Q2 to 2024-Q3 has been remarkably persistent in all the months we have been observing it and has increased in size. That persistence suggests investors have potentially built in expectations of turbulence ahead for dividend paying stocks.
That market turbulence would most likely take place during the upcoming quarter of 2024-Q2, which would subsequently show up in the dividends paid in the following quarter of 2024-Q3.
We're not even three full weeks into 2024-Q2 and the leading edge of that forecast market turbulence would appear to have arrived. The S&P 500 has dropped nearly four percent from the record high level it reached at the end of March 2024. Here's what the S&P 500's quarterly dividend futures look like as of Monday, 15 April 2024:
As expected, we've also had to reset the vertical scale of this chart to accommodate the dividends expected to be paid out in 2024-Q2, which has risen from $18.96 to $19.11 per share since our last snapshot.
Meanwhile, the amount of dividends expected to be paid out by S&P 500 firms during 2024-Q3 has decreased, falling from $17.82 to $17.72 during the last four weeks. The projected dividends for 2024-Q4 has likewise fallen, dropping from $18.45 to $18.31 during this interval.
The decline in expectations for the S&P 500's quarterly dividends in these future quarters is a consequence of a change in expectations for how the Federal Reserve will set short term interest rates in the U.S. Four weeks ago, the CME Group's FedWatch Tool indicated investors expected the Fed would launch a series of quarter point rate cuts at six-to-twelve week intervals before the end of 2024-Q2. As of 15 April 2024, the FedWatch Tool projects the Fed will only cut the Federal Funds Rate once during 2024. That cut is anticipated in September.
With U.S. interest rates being held higher for longer, the resulting higher cost of paying interest for borrowing money is expected to reduce the earnings of many of the companies whose stocks make up the S&P 500 index. Those lower earnings, in turn, mean lower dividend payouts.
There is a bright spot in this outlook, for which we also put down a marker with its own cautionary note:
Since quarterly dividends are projected to rise in 2024-Q4, that suggests investors expect this turbulence will be relatively short-lived.
At least, that's the implied expectation at this juncture. The most important thing to remember about the future is that it's subject to change with little notice.
A lot has changed in the last four weeks. Our next planned snapshot of S&P 500 quarterly dividend futures and what they indicate will be in five weeks.
Image Credit: Microsoft Copilot Designer. Prompt: "A fortune teller looking into a crystal ball to make a prediction about the S&P 500".
Labels: dividends, forecasting, SP 500
According to the U.S. Bureau of Labor Statistics, teen employment surged in March 2024.
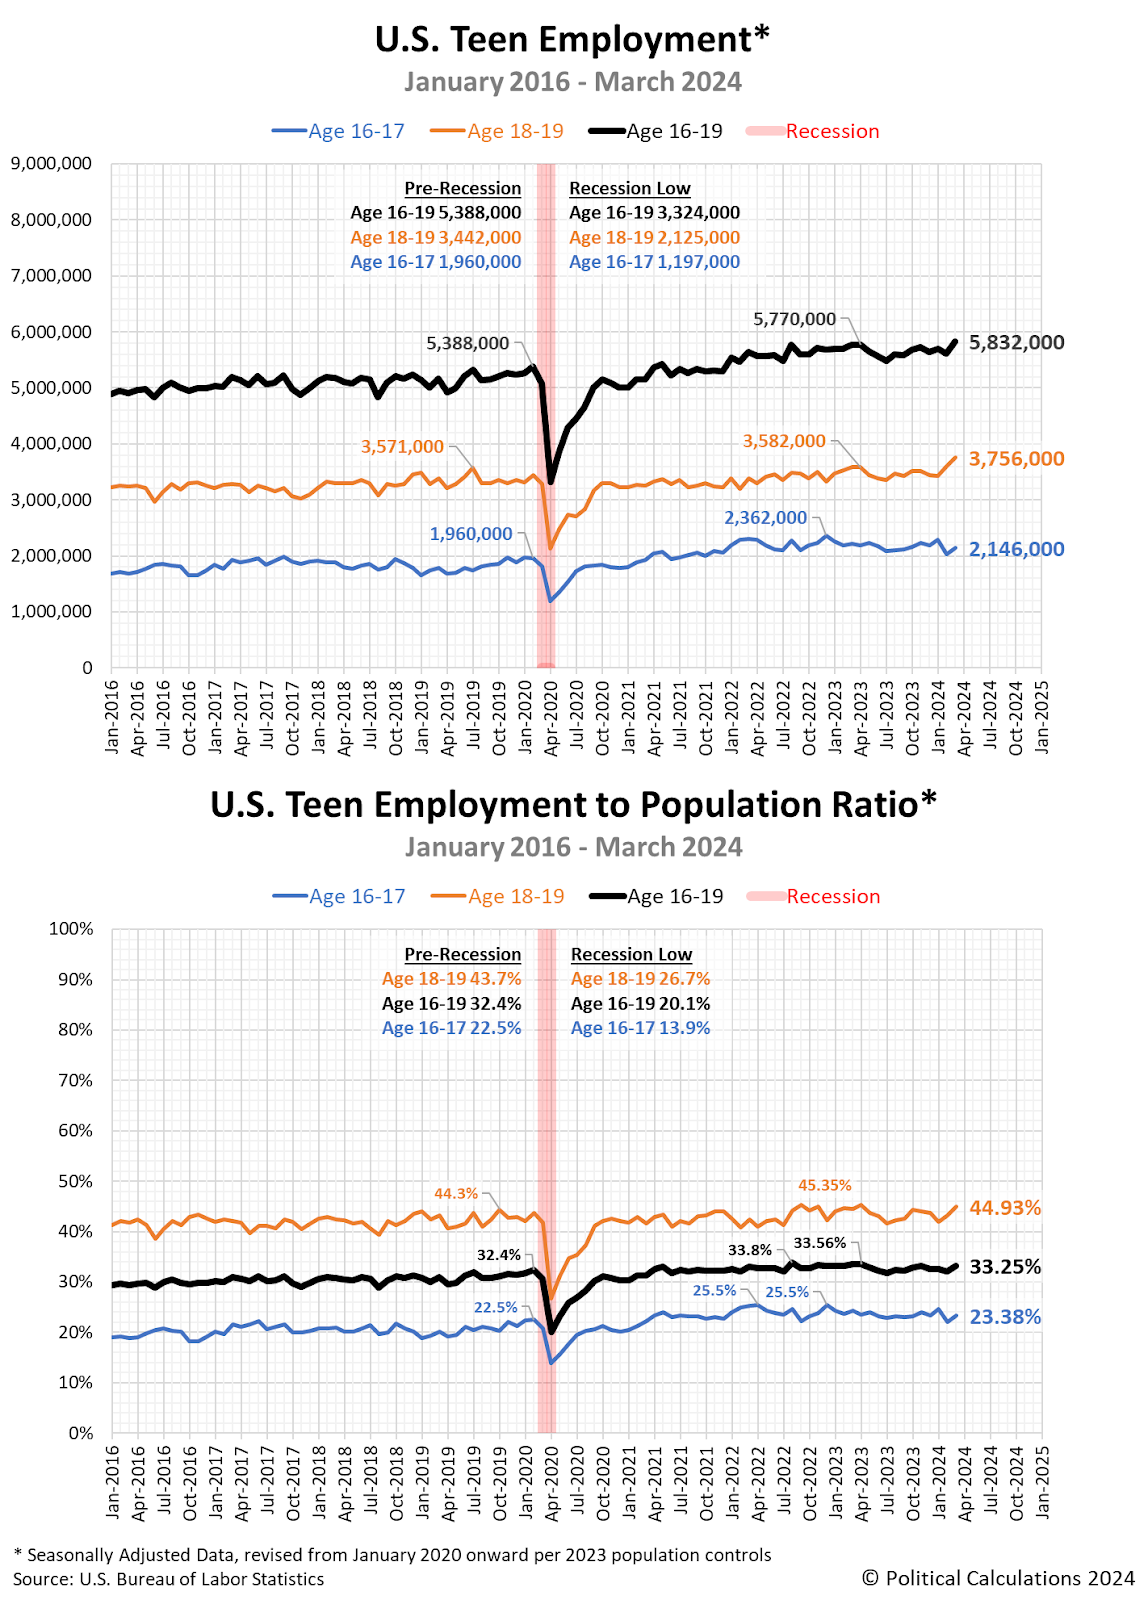
The seasonally-adjusted figures are pretty impressive. The number of teens Age 16 to 19 counted as employed jumped by 224,000 to reach 5,832,000 from February to March 2024. That's the highest reported figure since April 2008.
The employment situation in March 2024 was especially good for older teens. The number of Americans Age 18 and 19 with jobs rose 161,000 from the previous month's seasonally-adjusted total to 3,756,000, the highest this figure has been since May 2008.
Younger teens, Age 16 and 17, also saw a pickup in their number of employed, which rose 111,000 to a seasonally-adjusted 2,146,000 in March 2024. That figure is 6.5% below below their March 2022 peak, where we have to go back to mid-2007 to find a higher number of employed younger teens. With respect to that March 2022 peak, while March 2024 was positive, an overall downtrend for younger teens remains in place.
The following chart set visualizes the seasonally-adjusted numbers for the number of working teens in the U.S., showing the employment figures and employment-to-population percentages for younger teens (Age 16-17) and older teens (Age 18-19) as well as the combined population of working Age 16-19 year olds.
The share of employed teens among the population of Americans Age 16-19 remains below their 2023 peaks, but all in all, March 2024 was a good month for teens with working ambitions.
References
U.S. Bureau of Labor Statistics. Labor Force Statistics (Current Population Survey - CPS). [Online Database]. Accessed: 5 April 2024.
Image Credit: Microsoft Copilot Designer. Prompt: "Editorial cartoon of teenagers lining up to interview for a job at a store."
Labels: jobs
Inflationary price increases have resumed for Campbell's Tomato Soup.
Our monthly survey of the prices at which ten major grocery retailers are selling an iconic Number 1 size can of Campbell's Condensed Tomato Soup indicates upward price movement has resumed after stabilizing during the latter half of 2023.
The changes we're observing are significant for U.S. consumers because Campbell Soup (NYSE: CPB) has produced and sold its condensed tomato soup product in this standard 10.75 fluid ounce can continuously since January 1898. Because of that inherent characteristic, its price is not affected by the marketing trick of shrinkflation, in which producers try to hold their shelf prices steady for consumers in the face of sustained inflation by reducing the quantity of goods contained within their packaging. Its price cannot hide the corrosive effects of inflation within the economy.
Here are the prices we're observing in our mid-April 2024 survey along with how they have changed since our January 2024 report:
- Walmart: $1.26/each, unchanged
- Amazon: $1.26/each, decrease of $0.73 (-36.7%)
- Kroger: $1.39/each, increase of $0.10 (+7.8%)
- Walgreens: $1.99/each, unchanged
- Target: $1.39/each, unchanged
- CVS: $2.49/each, increase of $0.60 (+31.7%)
- Albertsons: $1.69/each, increase of $0.20 (+13.4%)
- Food Lion: $1.25/each, unchanged
- H-E-B: $1.31/each, unchanged
- Meijer: $1.29/each, unchanged
We think the most significant price change is the shelf price increase at Kroger-affiliated grocers. The Kroger (NYSE: KRO) family of grocery stores is the largest chain for this category of retailers in the United States. By comparison, Walmart (NYSE: WMT) is a larger retailer, but sells far more categories of consumer goods than just groceries. Together, these two companies sell more cans of tomato soup than many of the other grocers combined.
That includes Amazon, which is the only grocery-selling retailer to decrease their price in this report and which sells far fewer cans of soup than either Walmart or Kroger. Amazon is unusual among our surveyed grocery sellers in having very volatile pricing for Campbell's Condensed Tomato Soup, showing large swings in price from month to month. Our main takeaway in the online retailer's price for a single picnic-size can of Campbell's second-biggest selling soup product is that its April 2024 unit price is not less than $1.26, which is close to the floor among all our surveyed stores.
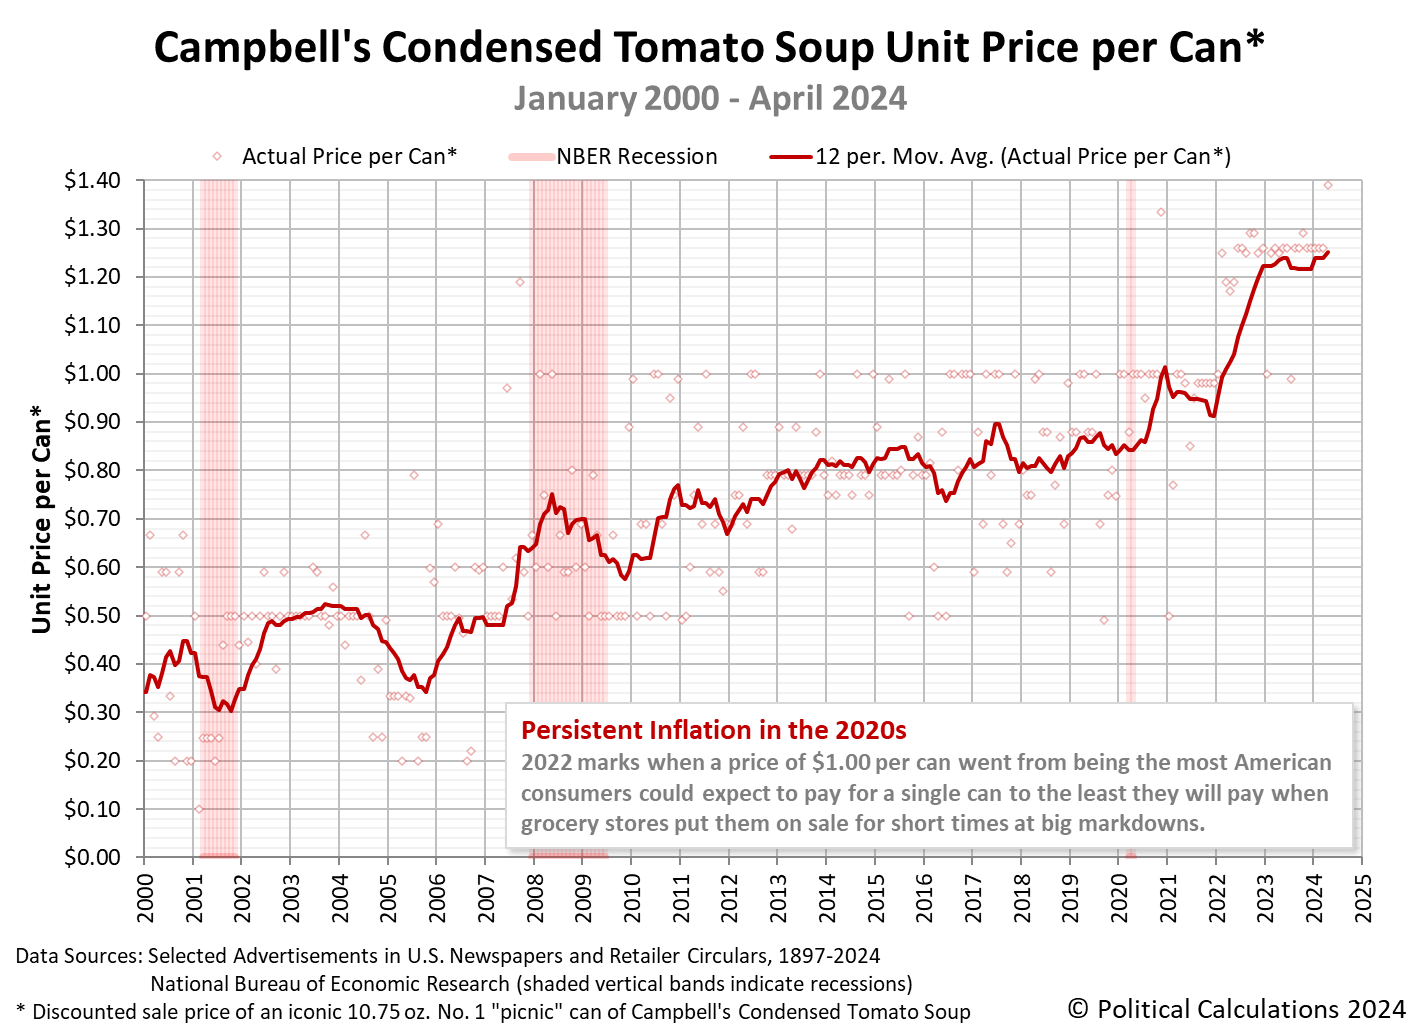
The following chart tracks the changing price of a 10.75 ounce can of Campbell's Condensed Tomato Soup from January 2000 through April 2024. (See this article for a chart visualizing our full price history from January 1898 through January 2024).
The trailing twelve month average price of a single can of Campbell's Condensed Tomato Soup is $1.25 in April 2024. This figure is 30% higher than what it was in March 2021 and is consistent with how overall food prices have changed in the U.S. economy in the period since the current era of elevated inflation began.
Image Credit: Microsoft Copilot Designer. Prompt: "A can of Campbell's Condensed Tomato Soup".
Welcome to the blogosphere's toolchest! Here, unlike other blogs dedicated to analyzing current events, we create easy-to-use, simple tools to do the math related to them so you can get in on the action too! If you would like to learn more about these tools, or if you would like to contribute ideas to develop for this blog, please e-mail us at:
ironman at politicalcalculations
Thanks in advance!
Closing values for previous trading day.
This site is primarily powered by:
CSS Validation
RSS Site Feed
JavaScript
The tools on this site are built using JavaScript. If you would like to learn more, one of the best free resources on the web is available at W3Schools.com.
