
The U.S. economy received an upside surprise in the third and final estimate of GDP for the first quarter of 2026. In nominal (not adjusted for inflation) terms, the nation's GDP reached $31.866 trillion after growing by an annualized rate of 5.76% over the previous quarter. The actual year-over-year increase in nominal GDP is 6.07%.
That's $361.7 billion (or 1.1%) higher than had been forecast by the climbing limo GDP forecasting method nearly three quarters ago, which we anticipated would understate the economy's growth.
Reports indicate business investments in Artificial Intelligence (AI) technology are responsible for the outperformance:
The most striking feature of the Q1 data is not its size but its composition. Business investment jumped 10.6% in the first quarter, a sharp acceleration from the 2.4% recorded in Q4 2025. Nearly all of that increase was concentrated in information processing equipment — computers, servers, and the physical infrastructure powering the artificial intelligence buildout — along with software and research and development spending.
Analyst estimates based on BEA sub-component data suggest that AI-related investment contributed roughly three-quarters of the quarter’s total GDP growth. The information sector, federal government spending, professional and scientific services, and durable goods manufacturing were the leading industry contributors. Meanwhile, retail trade, wholesale trade, and finance and insurance all declined.
Looking forward, the climbing limo GDP forecasting method anticipates nominal GDP will continue rising in 2026-Q2, reaching around $32.75 trillion. The following chart shows how actual non-inflation adjusted GDP estimates are tracking with the model's previous projections:

This estimate assumes the momentum the U.S. economy recorded in growing between 2025-Q1 and 2025-Q3 will be sustained through the ending calendar quarter of 2026-Q2. Given the momentum of actual GDP and the impact of the Iran war geopolitical event that wasn't a factor influencing the projection of GDP at the time of the model's momentum-based forecast, we think the climbing limo's projection of nominal GDP in 2026-Q2 will overstated.
The most distant future projection we can make with available finalized GDP data is for 2026-Q4, where the climbing limo forecasting method anticipates the nation's nominal GDP will end the year around $33.05 trillion.
References
U.S. Bureau of Economic Analysis. National Income and Product Accounts. Table 1.1.5. Gross Domestic Product. [Online Database]. Accessed 25 June 2026.
Image Credit: Microsoft Copilot Designer. Prompt: "A chart showing a limousine driving up a bumpy GDP trajectory that rises over time".
Labels: gdp, gdp forecast


The climbing limo method of forecasting future GDP in the United States projects the nation's economic output in the recently finished first quarter of 2026 will be around $31.5 trillion.
This estimate assumes the momentum the U.S. economy recorded in growing between 2024-Q4 and 2025-Q2 will be sustained through the recently ended quarter of 2026-Q1. Since the U.S. economy's momentum has come in stronger than expected over the intervening quarters since our last snapshot, it's likely 2026-Q1's will come in above that value, which is not adjusted for inflation.
These projections have been delayed because the Senate Democrats' government shutdown disrupted U.S. economic data reporting. It took until earlier this month to get finalized GDP data for both 2025-Q3 and Q4, which means we can now generate the climbing limo method's momentum-based projections for both 2026-Q2 and 2026-Q3. The following chart visually presents those projections while showing how actual non-inflation adjusted GDP tracked with the model's previous projections:

For the now current quarter of 2026-Q2, the climbing limo GDP forecasting method projects GDP will potentially rise to almost $32.8 trillion. Since that projection was generated with finalized GDP figures for 2025-Q1 and 2025-Q3, long before any impact from the Iran war would be felt, it will be interesting to see how well that forecast tracks with 2026-Q2's actual GDP.
That's because the climbing limo forecasting method is a momentum-based projection. As such, even when recorded GDP deviates considerably from the forecast values that are projected three quarters ahead in time, it provides valuable information in confirming the economy's underlying momentum has changed. We should get a good reading on how big the Iran war's impact has been on the U.S. economy after the actual GDP data for 2026-Q2 is reported.
Meanwhile, the most distant future projection we can make with available finalized GDP data is for 2026-Q3, where the climbing limo forecasting method anticipates the nation's nominal GDP will rise to about $32.9 trillion.
References
U.S. Bureau of Economic Analysis. National Income and Product Accounts. Table 1.1.5. Gross Domestic Product. [Online Database]. Accessed 9 April 2026.
Image Credit: Microsoft Copilot Designer. Prompt: "A simple sketch of a limousine driving uphill toward the right side of a rising zig zag line chart".
Labels: gdp forecast

The climbing limo method of forecasting future GDP in the United States projects the nation's economic output in the recently finished third quarter of 2025 will be around $30.9 trillion.
This estimate assumes the momentum the U.S. economy recorded in growing between 2024-Q2 and 2024-Q4 will be sustained through the current quarter. Since the U.S. economy's momentum has been slowing however, it's likely 2025-Q3's will come in below that value, which is not adjusted for inflation.
That's the same scenario we anticipated for 2025-Q2's finalized GDP estimate, which the following chart indicates held even as the BEA revised all the GDP data used to create the climbing limo forecasts.

Because the BEA revised all its GDP data going back to the first quarter of 2020, this chart shows the climbing limo GDP forecasts as if that data had been available throughout the period it covers.
Generally speaking, the BEA revised its nominal GDP data for all quarters from 2020-Q1 through 2025-Q1 upward by varying amounts, with the largest adjustments in the period from 2023-Q3 through 2025-Q1.
Looking at the recently released estimate for 2025-Q2, the climbing limo method had forecast GDP would clock in at about $30.58 trillion, which after the BEA's revisions, is now shown as nearly $30.76 trillion. The BEA's now official estimate of GDP for this quarter is $30.49 trillion. The official estimate came in lower than both the original and revised forecasts.
The climbing limo forecasting method is a "momentum"-based projection. As such, even when recorded GDP deviates considerably from the forecast values that are projected three quarters ahead in time, it provides valuable information in confirming the economy's underlying momentum has changed. For much of the period the chart shows, it confirms the U.S. economy's growth momentum has been slowing since its initial recovery from 2020's Coronavirus Pandemic Recession.
References
U.S. Bureau of Economic Analysis. National Income and Product Accounts. Table 1.1.5. Gross Domestic Product. [Online Database]. Accessed 26 September 2025.
Image Credit: Microsoft Copilot Designer. Prompt: "Image of a long limousine driving up a bumpy area chart labeled 'GDP'".
Labels: gdp forecast

The climbing limo method of forecasting future GDP in the United States projects the nation's economic output in the recently finished second quarter of 2025 will be around $30.5 trillion.
This estimate assumes the momentum the U.S. economy recorded in growing between 2024-Q1 and 2024-Q3 will be sustained through the current quarter. Unfortunately, the U.S. economy's momentum has been slowing, which suggests GDP for 2025-Q2 will come in below that estimate.
Speaking of which, that exact scenario played in the first quarter of 2025, which we can confirm with the third estimate of that quarter's GDP that was reported on 26 June 2025. The climbing limo method had forecast the economy would U.S. grow $30.1 trillion in nominal, non-inflation adjusted terms, which we projected three quarters ago. The actual figure came in at $30.0 trillion, which is not far off from that projection, but still undershoots it. This outcome confirms the nation's nominal economic growth has slowed.
We're citing these figures as if they're fully fixed, but they are still subject to annual revisions. The Bureau of Economic Statistics typically performs an annual revision for its GDP data sometime during the third quarter of each year, most often in July. When it does, we'll regenerate all the climbing limo forecasts based on how the official data changes.
Until then, the following chart shows the climbing limo method's forecast against the recorded nominal GDP over the past 12 quarters for which GDP data has been finalized outside of the BEA's annual revisions.

Regardless of revisions, the GDP data for 2025-Q2 will be something to watch because of the global tariff war that erupted on 2 April 2025 at the start of the quarter. The tariff war may have something of a wild card effect on the U.S. economy's growth trajectory, hinging on multiple factors that have been playing out within the economy during the last few months.
References
U.S. Bureau of Economic Analysis. National Income and Product Accounts. Table 1.1.5. Gross Domestic Product. [Online Database]. Accessed 26 June 2025.
Political Calculations. Forecasting GDP Using the Climbing Limo. [Online Tool]. 10 May 2005.
Image Credit: Microsoft Copilot Designer. Prompt: "A long limousine driving up a bumpy chart showing GDP growth".
Labels: gdp forecast

The climbing limo method of forecasting future GDP in the United States projects the nation's economic output in the first quarter of 2025 will be around $30.1 trillion.
This estimate assumes the momentum the U.S. economy recorded in growing between 2023-Q4 and 2024-Q2 will be sustained through the current quarter. That assumption is unlikely to hold however considering how 2025 has been unfolding.
There are lots of moving pieces affecting the growth trajectory of the U.S. economy, most of which were set in motion long before the quarter began. As such, it's quite possible the climbing limo forecast will be wrong. Which, believe it or not, is not a bad thing.
Here's why. The climbing limo method is a very simple forecasting technique that projects the level of GDP some three quarters into the future using the nominal GDP figures from five quarters and three quarters before that point in time. Its forecasts therefore represent the momentum of the U.S. economy recorded between the two data points it uses. Deviations between the actual trajectory of GDP and the forecast tells how the momentum of the U.S. economy has changed, which provides useful information even when the differences between forecast and actual values are large.
For example, the biggest deviations it sees typically happen at turning points for the U.S. economy, when it either enters or exits periods of recession. 2025-Q1 may be on the cusp of such a change.
We'll get the first estimates of 2025-Q1 actual GDP trajectory at the end of April 2025. Until then, the following chart shows the climbing limo method's forecast against the recorded nominal GDP over the past 11 quarters for which GDP data has been finalized outside of annual revisions.

Most GDP forecasts are projecting slower growth in 2025-Q1, with some anticipating negative growth at this writing. And that's without any impact from the global tariff war that erupted on 2 April 2025, which falls in 2025-Q2. How big do you suppose the deviation will be?
References
U.S. Bureau of Economic Analysis. National Income and Product Accounts. Table 1.1.5. Gross Domestic Product. [Online Database]. Accessed 6 April 2025.
Political Calculations. Forecasting GDP Using the Climbing Limo. [Online Tool]. 10 May 2005.
Image Credit: Microsoft Copilot Designer. Prompt: "A limousine navigating an uphill, rocky road".
Labels: gdp forecast

The climbing limo method of forecasting future GDP in the United States projects the nation's economic output in the fourth quarter of 2024 will be approximately $29.6 trillion.
If that number sounds familiar, it's nearly identical to the climbing limo's forecast for 2024-Q3, in which we indicated that quarter's nominal GDP would "be within a few percentage points" of that figure. With the third estimate of GDP now available, we can confirm that forecast was less than one percent off the mark. At $29,374.9 billion, nominal GDP came in below the climbing limo's forecast by 0.8%.
This time around, we think that with the climbing limo forecast nearly unchanged from the previous quarter, the actual nominal GDP figure to be reported by the Bureau of Economic Analysis has a good chance of coming in higher that the climbing limo forecast, similar to what happened in 2024-Q1.
You can judge that likelihood for yourself in the following chart, which tracks the climbing limo method's forecast against the recorded nominal GDP over the past 10 quarters for which GDP data has been finalized outside of annual revisions.

This chart adds the climbing limo's forecast for GDP in 2025-Q2, which at nearly $30.54 trillion, represents a 1.3% increase over the forecast for 2025-Q1.
About the Climbing Limo Forecasting Method
The climbing limo method is a very simple forecasting technique that projects the level of GDP some three quarters into the future using the nominal GDP figures from five quarters and three quarters before that point in time. As such, its forecast represents the momentum of the U.S. economy recorded between the two data points it uses. Deviations between the actual trajectory of GDP and the forecast tells how the momentum of the U.S. economy has changed, which provides useful information even when the differences between forecast and actual values are large.
For example, the biggest deviations it sees typically happen at turning points for the U.S. economy, when it either enters or exits periods of recession. Since 2022-Q3, the forecasts confirm the growth momentum of the U.S. economy has slowed, though it remains on an upward trajectory.
References
U.S. Bureau of Economic Analysis. National Income and Product Accounts. Table 1.1.5. Gross Domestic Product. [Online Database]. Accessed 19 December 2024.
Political Calculations. Forecasting GDP Using the Climbing Limo. [Online Tool]. 10 May 2005.
Image Credit: Microsoft Copilot Designer. Prompt: "A limousine driving up a bumpy, dirt road with the license plate labeled 'GDP'".
Labels: gdp forecast

The climbing limo method of forecasting future GDP in the United States projects the nation's economic output in the third quarter of 2024 will be within a few percentage points of $29.6 trillion.
The U.S. Bureau of Economic analysis released a pretty extensive set of revisions for its GDP data going back to January 2019, which changed the climbing limo's forecast for what non-inflation adjusted GDP will be in 2024-Q3. The new forecast is nearly one percent higher than the original forecast for the quarter.
The climbing limo's latest projections based on the revised data can be seen in the following chart, which also adds the first projection for how large the non-inflation adjusted economy will be in 2025-Q1.

The climbing limo method is a very simple forecasting technique that projects the level of GDP some three quarters into the future using the nominal GDP figures from five quarters and three quarters before that point in time. As such, its forecast represents the momentum of the U.S. economy recorded between the two data points it uses. Deviations between the actual trajectory of GDP and the forecast tells how the momentum of the U.S. economy has changed, which provides useful information even when the differences between forecast and actual values are large.
References
U.S. Bureau of Economic Analysis. National Income and Product Accounts. Table 1.1.5. Gross Domestic Product. [Online Database]. Accessed 4 October 2024.
Political Calculations. Forecasting GDP Using the Climbing Limo. [Online Tool]. 10 May 2005.
Image Credit: Microsoft Copilot Designer. Prompt: "A simple sketch of a limousine driving uphill toward the right side of a rising zig zag line chart".
Labels: gdp forecast
Later this week, on Thursday, 25 July 2024, the Bureau of Economic Analysis will publish its first estimate of the United States' Gross Domestic Product during the second quarter of 2024.
With that date just a day away, it's a good time to check in with how 2024-Q2's GDP tracks with what a momentum-based forecasting method projected it would be for this quarter over seven months ago. That simple method, called the "Climbing Limo", uses nominal GDP data that was available back in December 2023 in its projections.
As you can see in the following chart, that method came within one percent of anticipating the final GDP estimate for the first quarter of 2024 (2024-Q1), the data for which only became available last month.

Coincidentally, the Atlanta Fed's GDPNow forecast for 2024-Q1 was correct in projecting 2024-Q1's actual GDP exceeded the climbing limo's momentum-based forecast for this period.
Looking forward, since the GDP data for 2024-Q1 has been finalized, the Climbing Limo projection of GDP built using that data point suggests the United States' nominal GDP is on track to rise through the end of 2024 at a steady pace.
Update 25 July 2024
The BEA's first estimate of nominal GDP for 2024-Q2 is $28,629.2 billion (nominal = not adjusted for inflation). That figure is 0.8% below the Climbing Limo's forecast of $28,849.4 billion for 2024-Q2, as the U.S. economy would appear to be returning to underperforming the forecasting method's projection of where it would be based on its previous momentum.
References
U.S. Bureau of Economic Analysis. National Income and Product Accounts. Table 1.1.5. Gross Domestic Product. [Online Database]. Accessed 27 June 2024.
Political Calculations. Forecasting GDP Using the Climbing Limo. [Online Tool]. 10 May 2005.
Image Credit: Microsoft Copilot Designer. Prompt: "A simple sketch of a limousine driving uphill toward the right side of a rising zig zag line chart".
Labels: gdp forecast

Later this week, on Thursday, 25 April 2024, the Bureau of Economic Analysis will publish its first estimate of the United States' Gross Domestic Product during the first quarter of 2024.
Because that date is so close, it's a good opportunity to check in with how 2024-Q1's GDP tracks with what a momentum-based forecasting method projected it would be for this quarter over seven months ago. That simple method, called the "Climbing Limo", uses nominal GDP data that was available back in September 2023 in its projections.
The following chart reveals how closely that method worked for anticipating the final GDP estimate for the fourth quarter of 2023 (2023-Q4), which only became available last month. As you can see, there's only a half-percent difference between the forecast for 2023-Q4's nominal GDP and the BEA's official estimate for the quarter.
If the Atlanta Fed's GDPNow forecast for 2024-Q1 is right, this quarter could be the first in which actual GDP exceeds the climbing limo's momentum-based forecast in the period covered by the chart.
Which means nearly nothing. That's because when economic growth is relatively stable, it's common for forecast and actual GDP data series to periodically cross over each other just based on variation in the data. For the period shown on the chart, which presents the Climbing Limo forecast using only the actual GDP data shown on the chart, it has been unusual for actual GDP to have so consistently underperformed the momentum-based forecast.
That could be because inflation, which is built into the nominal GDP estimates, has been slowing over this period. But there are other potential explanations that could account for that pattern as well, including slowing momentum in the U.S. economy after the initial phase of the post-Coronavirus Recession recovery.
Regardless, it will be another two months before we get the BEA's final GDP estimate for the first quarter of 2024 to see how good the Climbing Limo's forecast for 2024-Q1 turned out to be.
Looking much further forward, since the GDP data for 2023-Q4 has been finalized, the Climbing Limo method projection using that data point suggests some rather robust GDP growth through the third quarter of 2024. Unfortunately, it will be months before we find out how good that forecast is. As a general rule of thumb, it's usually within a few percentage points of the actual GDP estimate, but that can change if the economy turns a proverbial corner, either for the better or for the worse. In either of these cases, a comparison with the Climbing Limo forecast provides a useful confirmation of which situation applies.
Update 25 April 2025
The BEA issued its first estimate of nominal GDP for 2024-Q1: $28,284.5 billion. That figure is 0.7% higher than the seven-month old climbing limo forecast of $28,075.4 billion, so reported GDP has crossed above the climbing limo projection. The BEA will finalize its GDP estimate for the quarter, at least outside of its annual revisions, at the end of June 2024. Most news reporting is focusing on the inflation-adjusted "real" GDP figures coming in lower than had been forecast. The first estimate of the real growth rate for 2024-Q1 is 1.6%, the Atlanta Fed's GDPNow forecast tool had antipated 2.7% growth as recently as 24 April 2024.
References
U.S. Bureau of Economic Analysis. National Income and Product Accounts. Table 1.1.5. Gross Domestic Product. [Online Database]. Accessed 21 April 2024.
Political Calculations. Forecasting GDP Using the Climbing Limo. [Online Tool]. 10 May 2005.
Image Credit: Microsoft Copilot Designer. Prompt: "A limousine with the letters 'GDP' driving upward to the top of a hill on a very rocky road, with the limousine driving on the rocks".
Labels: gdp forecast

Momentum. If you ever wondered what the single biggest factor that sets the trajectory of economic growth is, that's the answer. It's momentum.
For example, let's say you wanted to predict how big the U.S. economy would grow to be over the next few quarters, but you didn't know anything more than what the nation's GDP was during the last few quarters. More often than not, that's enough information to put you within a few percent of the actual GDP result. Even when the projection is off by more than that, it still tells you something useful about how the economy is performing.
That's the thinking behind the "Climbing Limo" forecasting method, which is a very simple approach to reasonably project what to expect for GDP. Here's how it works. Start with the most recently finalized quarterly GDP data you have available and the GDP recorded two quarters before that and draw them on a chart with GDP on the vertical axis and quarters on the horizontal. You would next connect those dots with a straight line, then extend that line three quarters into the future to draw a new dot at the end of that line. That's your forecast for that future quarter.
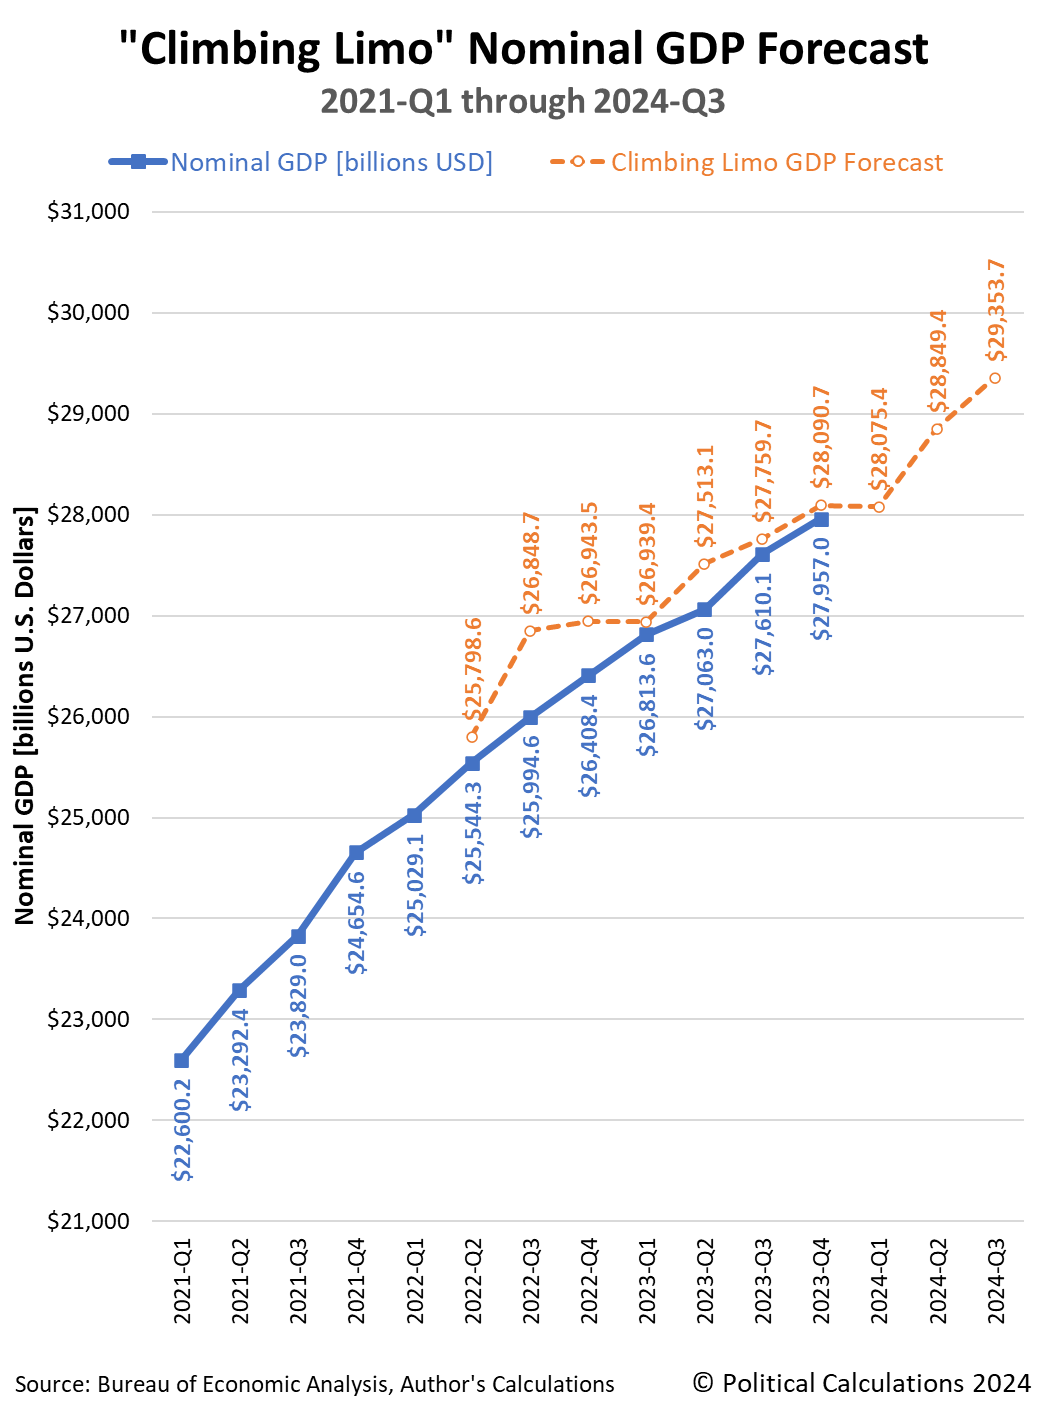
We've done that exercise in the following chart with the available GDP data for the period running from the first quarter of 2021 through the third quarter of 2023. In the chart, the blue solid line represents that actual nominal GDP data, while the orange dashed line represents the forecasted GDP, which starts at the second quarter of 2022 and run through the second quarter of 2024.

All but one of the forecast values on this chart are within three percent of the actual quarterly result after it was finalized in the Bureau of Economic Analysis' third estimate a few months after the quarter ended. As you can see, some forecast results are very close to the officially recorded finalized value.
The largest deviation between forecast and actual GDP is for the second quarter of 2022 (2022-Q2), where the forecast value is 3.3% higher than the actual value. That forecast is based on the actual GDP datapoints for 2021-Q1 and 2021-Q3 and represents how much larger GDP could have been if economic growth sustained the momentum it recorded between these two quarters.
That it isn't tells us something changed between 2021-Q3 and 2022-Q3 to affect the growth path for the U.S. economy. That's the kind of useful information we can extract from the chart whenever we see the deviation between forecast and actual data gets larger than a three percent threshold. It often signals a turning point.
In this case, 2022-Q3 represents when the Federal Reserve's actions to increase interest rates to combat the inflation unleashed in the U.S. economy between 2021-Q1 and 2021-Q3 started making their presence felt as a change in momentum for GDP.
The chart is unusual in that all the forecast values have run higher than the actual GDP figures. When we've done similar exercises in the past, we've typically seen the two data series cross over each other, with the data points well within that three percentage point margin. That pattern is what you would expect during periods when economic growth momentum is relatively consistent.
But instead of that pattern, the chart shows the period between 2022-Q2 and 2023-Q3 has been one in which the U.S. economy has experienced fading momentum.
The first estimate for GDP during the fourth quarter of 2023 will be released on Thursday, 25 January 2024. While not the final value, where it falls with respect to the forecast will give an idea of whether that fading momentum pattern continued through the end of 2023. We timed this article so you wouldn't have to wait long to find out. The references below will take you to where you can access the data you need and our climbing limo tool where you can do the math for yourself.
Update 26 January 2024
The first estimate of the United States' GDP in 2023-Q4 is now available, with nominal GDP being initially reported at $27,938.8 billion, which is 0.5% below the climbing limo estimate. The nominal GDP estimate for this quarter will be revised twice more before it is relatively finalized (outside of annual revisions) in March 2024. The climbing limo estimate for 2023-Q4 is based on the non-inflation adjusted GDP figures reported for 2022-Q3 and 2023-Q1.
References
U.S. Bureau of Economic Analysis. National Income and Product Accounts. Table 1.1.5. Gross Domestic Product. [Online Database]. Accessed 20 January 2024.
Political Calculations. Forecasting GDP Using the Climbing Limo. [Online Tool]. 10 May 2005.
Image credit: Microsoft Bing Image Creator. Prompt: "The side view of a limousine driving on bumpy rocks, highly detailed, 4k, award winning automobile magazine photography."
Labels: gdp forecast
It took nearly a month after we first pointed it out, but someone has taken advantage of a unique investment opportunity that we identified with the options for the S&P 500's quarterly dividend futures!
And because they did, we now have a better and more up-to-date picture of how much S&P 500 companies are expected to collectively pay out in dividends to investors in 2018-Q2, where in this case, we can now show how much the expectations for dividends to be paid out in this upcoming quarter have changed thanks to a combination of improved organic corporate earnings and, perhaps more significantly, the effect of the permanent corporate income tax cuts passed in late December 2017.

The sudden change in the CME Group's S&P 500 quarterly dividend futures came on 5 March 2017, which vaulted slightly ahead of the bottoms-up dividends per share estimate indicated by IndexArb, which is how we were able to identify that a trading opportunity existed in the first place. In jumping from $12.70 per share to $13.20 per share, the CME Group's dividend futures for the S&P 500 in 2018-Q2 are now communicating that investors stand to collect an additional 50 cents per share in that future quarter compared to what the dividend futures had been indicating since at least mid-December 2017.
We believe that this particular opportunity existed because the CME Group's quarterly dividend futures for the S&P 500 have been trading on very thin volumes. Their annual quarterly divided futures for the S&P 500 see more action, where the mismatch between the S&P 500's projected annual dividends per share for 2018 and the sum of their projected quarterly dividend futures for the S&P 500 for 2018 also confirmed the existence of the trading opportunity.
In terms of real money, the 50 cent per share increase in projected S&P 500 dividends means that investors will collectively rake in upwards of $4.47 billion more in dividends during the second quarter of 2018 than they were expecting prior to the passage of the Tax Cuts and Jobs Act of 2017. Altogether, the updated dividend futures project that S&P 500 companies would pay out over $118 billion in dividends during 2018-Q2. Or since we're talking about dividend futures, over the period from the end of the third Friday of March 2018 through the end of the third Friday of June 2018. And there's still lots of time between now and Friday, 15 June 2018 for dividends payouts in 2018-Q2 to change further.
Now that the "easy" money on the sidewalk for the S&P 500's 2018-Q2 dividend futures has been picked up, we'd be remiss if we didn't point you another interesting opportunity to pick up some other money that's figuratively lying on the sidewalk - only this opportunity won't cost you a dime, because its really a contest. It's Hypermind's Nominal GDP Prediction Market, where your goal is to predict what the U.S. economy's growth rate for nominal GDP (or real GDP plus inflation) will be at the time that Hypermind's currently available future contracts for its NGDP prediction market expire in either April 2018 or in April 2019.
If you're interested, check out Hypermind's description of how it works (click each of the different icons at the top of the page), along with Scott Sumner's recent description of how thinly traded those particular futures have been. Like us with the S&P 500 quarterly dividend futures and our use of that data to project the actual trajectory of the S&P 500, he has ulterior motives in promoting the NGDP prediction market, but like us, they're the good kind!
Labels: dividends, gdp forecast, investing, SP 500
Updates! Scroll down....
Nearly a month ago, we presented our "most likely" prediction for how the U.S. Bureau of Economic Analysis will revise the U.S.' Real Gross Domestic Product on Friday, 29 July 2016.
Let's recap what we forecast, picking things up from after we described how we went from estimating the "maximum potential" size of the revision to the "maximum likely" size of it, before we drilled down to what we think will be the "most likely" amount by which real GDP will be revised through the fourth quarter of 2015:
But the "maximum likely" revision of -1.4% of previously reported GDP through 2015-Q4 is not the "most likely" size of the upcoming revision to the nation's GDP will be, because the BEA's plans for the revision of the national level GDP data will only cover the period from 2013-Q1 through 2016-Q1.
That means that it will miss the discrepancy that opens up in 2012-Q3 and 2012-Q4 between the just-revised state level GDP and previously indicated overseas federal GDP and its previously recorded national level GDP. That discrepancy is just over $55.1 billion in terms of constant 2009 U.S. dollars in 2012-Q4, which itself is over 24% of the full $225.7 billion discrepancy that our previous calculations indicates between the pre-revised national level real GDP and the post-revised state level GDP data through 2015-Q3.
Because the BEA won't be including that $55.1 billion portion of the discrepancy from 2012, the "most likely" size of the revision that it will report at the end of July 2016 is therefore -1.1%, which is 24% less than the "maximum likely" revision of -1.4% we previously calculated.
After the BEA's annual revision of GDP for the 50 states and the District of Columbia on 14 June 2016, there is only one factor left that can affect the amount by which the BEA will actually revise the nation's total real GDP next week - the contribution of overseas federal military and civilian government activities, or as we've described it, the "hidden GDP of war".
There are three scenarios in how that one factor can play out:
- If that contribution is greater than what the BEA has previously indicated, the amount by which real GDP through 2015-Q4 will be adjusted will be smaller. So instead of being reduced by 1.1% as we've projected to be "most likely", it would instead be reduced by a smaller percentage, or in the very unlikely case that contribution is much, much greater, real GDP through 2015-Q4 could be adjusted upward. For this scenario to occur, it would mean that the U.S. government was much more engaged in fighting wars overseas in a way that adds to the nation's GDP than it has previously indicated. This is the "under" scenario.
- If that contribution is less than that the BEA has previously indicated, the amount by which real GDP through 2015-Q4 will be adjusted downward will be larger, going in the direction of what we calculated would be the maximum likely revision. For this scenario to occur, it would mean that the U.S. government was engaged in less "productive" military and civilian government activities overseas than it has previously indicated. This is the "over" scenario.
- If the contribution is the same as what the BEA has previously indicated, then we'll see the "most likely" scenario we calculated be the actual result. Real GDP through 2015-Q4 would be decreased by about 1.1% from the level that was recorded earlier this year on 29 March 2016. This might be considered the "null" scenario.
To make that question more interesting, we asked our most dedicated readers [1] to click through and answer a SurveyMonkey poll, which we've now closed. The results of that poll are presented in the following chart.

As you can see, our poll produced a 40-40-20 split. 40% of the poll participants indicated they thought Scenario #1 was more likely, 40% predicted Scenario #2 would be a reality, and 20% believed in the Scenario #3 "no change from our forecast outcome" outcome.
While those results seem nearly split down the middle, what they really indicate is that the majority of the poll participants believe that the actual adjustment to real GDP through 2015-Q4 will be different from our "most likely" forecast for the size of the July 2016 national revision. What is equally split down the middle is the direction in which it will be adjusted, with no clear collective prediction emerging from our poll.
Where is Philip Tetlock when you need him?
Notes
[1] We had problems with generating working code to embed the survey directly in our post, so we were stuck with providing a link for readers to click through to participate in the survey. That's the sort of hassle that only the most dedicated readers would endure, so we greatly appreciate the extra effort on the part of all the participants who registered their own prediction for how this one aspect that will affect the actual size of the upcoming GDP revision. Thank you!
Update 27 July 2016: This is so cool! We had an extended contact today with an analyst who works for the BEA, who wanted to know more about how we came up with our estimate of how real GDP would change using the BEA's recently revised regional account data.
That was fantastic timing, because we just happened to have our spreadsheet open because we were updating it with state level GDP data from 2016-Q1 that was just released today.
In going over that material, we discovered a problem that threw off our calculations, with the effect that the results we had obtained weren't matching what they were getting from 2014-Q3 onward in replicating our analysis. We were able to trace the problem back to the GDP deflator that we used to convert nominal GDP data to inflation-adjusted "real" data, where we were multiplying the nominal data by the GDP deflator data for the national level data (the data whose revision is set to be published on Friday, 29 July 2016) instead of the GDP deflator data that applies for the aggregate 50 states plus Washington DC, which just happened to be in the spreadsheet column next to it.
After we made the appropriate correction, all our results from 2014-Q3 onward snapped into place and all results matched, from the period from 2005-Q1 through 2014-Q2, where there was never any problem, and now from 2014-Q3 through 2015-Q4! The following chart shows the latest and greatest for what we expect from Friday's GDP revision based only on the state level GDP revision from June!

As for the outcome of the analysis, the error we made with using the incorrect GDP deflator overstated the amount by which real GDP is likely to be revised by 0.5% of GDP, so instead of the maximum likely change of -1.4% that we had previously calculated, the maximum amount by which national GDP might change as a result of the revisions the BEA has made to its GDP data for the 50 states plus Washington DC is -0.9%, with the maximum discrepancy now taking place in 2013-Q3. This data is indicated in the chart above by the dark-green line.
But since the BEA's national revision will cover the period from 2013-Q1 to the present, the revision of the national level GDP will not include the now-confirmed $55 billion discrepancy that opens up between the national GDP data and the national aggregate state level GDP in 2012. We are therefore now estimating that the most likely revision that will be made to the national GDP data on Friday, 29 July 2016 will be an adjustment of -0.6% in 2013-Q3. This data is indicated in the chart above by the bright red line (and the blue arrow at 2013-Q3).
We'd like to thank everyone who provided their useful assistance in getting to this point - in terms of collaborative effort, this has been one of the biggest projects we've had the pleasure of working on since launching Political Calculations. It's always exciting when we get to break brand new ground and do analysis that was never possible before, and we appreciate your shared enthusiasm!
On a final note, if you happened to have come across this post by way of Econbrowser, you might want to pass along information back to the author who pointed you in this direction that their observations have been described as "not relevant". We're pretty sure that particular author hears that a lot ....
There's more that we'd like to be able to discuss on the topic of the upcoming national-level GDP revision, but that will have to wait until after that data is released. Until then, what you see above represents the most that anyone can reasonably glean about what the revision will look like based only on data that is already available to the public.
Update 29 July 2016: The verdict is in! The chart below shows the revisions in national level real GDP from 2013-Q1 through 2015-Q4....

Compared to our final pre-revision prediction from 27 July 2016, we were off by 0.1% of GDP through 2015-Q4, where we had previously projected no change.
More significantly however, national-level real GDP was increased by 0.2% of its previously reported figure in 2013-Q3, where the aggregate GDP data for the 50 states and the District of Columbia had instead indicated that a 0.6% of GDP decline for that quarter was most likely. That means that the amount of GDP that the U.S. generated in that quarter from Overseas Federal Military and Civilian Government Activities was revised to be significantly much higher than the BEA had previously indicated, in effect, adding an additional 0.8% of GDP on top of what the BEA now indicates was generated within the actual territory of the United States.
We'll dig deeper into the national-level GDP revision periodically over the next several weeks!
Finally, our congratulations to the 40% of respondents in our poll who chose the "under" scenario - well done!
Labels: gdp forecast
Updates! Scroll down....
How much will U.S. GDP most likely be revised when the U.S. Bureau of Economic Analysis publishes its annual revision to the nation's real GDP on 29 July 2016?
We started working on that question last Thursday, the day after the BEA released its revision of GDP data for the individual 50 states and the District of Columbia, when we identified the "maximum potential" size of the revision to be a -2.0% decline from its value that was recorded at the end of 2015.
We updated that post two days later to take into account the contribution to national GDP from the U.S. government's overseas military and civilian activities, which add to the GDP contributed by the 50 states and the nation's capital to be equal to what the BEA should report for the nation's entire GDP. (Although we did that work last Friday, we only just featured that contribution to national GDP in the period from 2005-Q1 through 2015-Q3 yesterday.)
We then used that information along with the BEA's just-revised data for the individual 50 states plus DC to determine the "maximum likely" size of the upcoming revision to the nation's real GDP. The chart below reveals what we found.

But the "maximum likely" revision of -1.4% of previously reported GDP through 2015-Q4 is not the "most likely" size of the upcoming revision to the nation's GDP will be, because the BEA's plans for the revision of the national level GDP data will only cover the period from 2013-Q1 through 2016-Q1.
That means that it will miss the discrepancy that opens up in 2012-Q3 and 2012-Q4 between the just-revised state level GDP and previously indicated overseas federal GDP and its previously recorded national level GDP. That discrepancy is just over $55.1 billion in terms of constant 2009 U.S. dollars in 2012-Q4, which itself is over 24% of the full $225.7 billion discrepancy that our previous calculations indicates between the pre-revised national level real GDP and the post-revised state level GDP data through 2015-Q3.
Because the BEA won't be including that $55.1 billion portion of the discrepancy from 2012, the "most likely" size of the revision that it will report at the end of July 2016 is therefore -1.1%, which is 24% less than the "maximum likely" revision of -1.4% we previously calculated.
Our "most likely" estimate assumes however that the BEA's estimates of the contribution to national GDP from the U.S. government's overseas military and civilian activities will not greatly change from what it has previously indicated. Should the BEA revise its estimates of this component of nation real GDP, the actual size of the BEA's upcoming revision to the national GDP will entirely depend upon how that single factor might change.
In the case that it turns out that more GDP than previously indicated was generated through supporting the U.S. government's various overseas activities, the actual magnitude of the revision will be smaller than what we've now indicated the "most likely" size of the revision to be, and vice versa for the opposite scenario.
So if you want to place your bets on the over or under, all you need to do is to take your best guess as to just how much more or less of the nation's real GDP has been generated through supporting the U.S. government's activities overseas than what the BEA has previously indicated. To make it interesting, we've set up an online survey where you can put in your two cents and also find out what the consensus is for all those who have answered that single question!
Update 27 July 2016: This is so cool! We had an extended contact today with an analyst who works for the BEA, who wanted to know more about how we came up with our estimate of how real GDP would change using the BEA's recently revised regional account data.
That was fantastic timing, because we just happened to have our spreadsheet open because we were updating it with state level GDP data from 2016-Q1 that was just released today.
In going over that material, we discovered a problem that threw off our calculations, with the effect that the results we had obtained weren't matching what they were getting from 2014-Q3 onward in replicating our analysis. We were able to trace the problem back to the GDP deflator that we used to convert nominal GDP data to inflation-adjusted "real" data, where we were multiplying the nominal data by the GDP deflator data for the national level data (the data whose revision is set to be published on Friday, 29 July 2016) instead of the GDP deflator data that applies for the aggregate 50 states plus Washington DC, which just happened to be in the spreadsheet column next to it.
After we made the appropriate correction, all our results from 2014-Q3 onward snapped into place and all results matched, from the period from 2005-Q1 through 2014-Q2, where there was never any problem, and now from 2014-Q3 through 2015-Q4! The following chart shows the latest and greatest for what we expect from Friday's GDP revision based only on the state level GDP revision from June!
As for the outcome of the analysis, the error we made with using the incorrect GDP deflator overstated the amount by which real GDP is likely to be revised by 0.5% of GDP, so instead of the maximum likely change of -1.4% that we had previously calculated, the maximum amount by which national GDP might change as a result of the revisions the BEA has made to its GDP data for the 50 states plus Washington DC is -0.9%, with the maximum discrepancy now taking place in 2013-Q3. This data is indicated in the chart above by the dark-green line.
But since the BEA's national revision will cover the period from 2013-Q1 to the present, the revision of the national level GDP will not include the now-confirmed $55 billion discrepancy that opens up between the national GDP data and the national aggregate state level GDP in 2012. We are therefore now estimating that the most likely revision that will be made to the national GDP data on Friday, 29 July 2016 will be an adjustment of -0.6% in 2013-Q3. This data is indicated in the chart above by the bright red line (and the blue arrow at 2013-Q3).
We'd like to thank everyone who provided their useful assistance in getting to this point - in terms of collaborative effort, this has been one of the biggest projects we've had the pleasure of working on since launching Political Calculations. It's always exciting when we get to break brand new ground and do analysis that was never possible before, and we appreciate your shared enthusiasm!
On a final note, if you happened to have come across this post by way of Econbrowser, you might want to pass along information back to the author who pointed you in this direction that their observations have been described as "not relevant". We're pretty sure that particular author hears that a lot....
There's more that we'd like to be able to discuss on the topic of the upcoming national-level GDP revision, but that will have to wait until after that data is released. Until then, what you see above represents the most that anyone can reasonably glean about what the revision will look like based only on data that is already available to the public.
Update 29 July 2016: The verdict is in! The chart below shows the revisions in national level real GDP from 2013-Q1 through 2015-Q4....
Compared to our final pre-revision prediction from 27 July 2016, we were off by 0.1% of GDP through 2015-Q4, where we had previously projected no change.
More significantly however, national-level real GDP was increased by 0.2% of its previously reported figure in 2013-Q3, where the aggregate GDP data for the 50 states and the District of Columbia had instead indicated that a 0.6% of GDP decline for that quarter was most likely. That means that the amount of GDP that the U.S. generated in that quarter from Overseas Federal Military and Civilian Government Activities was revised to be significantly much higher than the BEA had previously indicated, in effect, adding an additional 0.8% of GDP on top of what the BEA now indicates was generated within the actual territory of the United States.
We'll dig deeper into the national-level GDP revision periodically over the next several weeks!
Labels: gdp, gdp forecast
Last week, economist Steve Keen went on record to predict that Australia's economy would fall into recession in 2017.
In doing that, Keen made a back-of-the-envelope calculation linking changes in the rate of private sector debt growth available with real economic growth available via an Excel spreadsheet.
We were intrigued by the math, so we've converted the spreadsheet math into the simple tool below, in which anyone can play with the numbers to predict how a nation's economic growth might change over the next year based on just a handful of factors.
The default numbers apply for the years 2016 and 2017 for Keen's Australia example, but you're more than welcome to substitute the numbers that apply for other nations or years of interest. If you're reading this article on a site that republishes our RSS news feed, please click here to access a working version of this tool!
In the tool above, "Current Nominal Credit Growth Rate" is the rate at which private sector debt increased from the previous period to reach its current value. The "Projected Nominal Credit Growth Rate" is the rate that would apply in the future period under consideration.
The reason why changes in the rate at which private sector debt grows would have predictive power for future economic performance comes down to why people in the private sector of the economy take on debt in the first place. It is because they reasonably expect to have sufficient income in the future where they will be able to make payments without significant problems.
As such, the forward-looking expectations that influence decisions to take on debt in the private sector, and consequently economic growth as a result, serve a similar role to what the expectations for earning dividends in the future do for setting the current and projecting the future value of stock prices. The math involved is certainly very similar.
As for Steve Keen's recession call for Australia, we should caution that he has been famously wrong before, particularly with respect to Australian housing prices, yet at the time he made that ill-fated prediction, the impact of China's massive economic stimulus on the strength of Australia's resource-exporting economy was an unknown factor. China's stimulus worked to significantly boost Australia's economy in 2009 and 2010, helping the nation to avoid falling into recession at that time, which in turn, also helped sustain housing prices.
The rapid deceleration of China's economy today as the remnants of that previous stimulus effort evaporate provides a good argument in support of why a recession in Australia's future has become increasingly likely at this time.
It will be interesting to see what factors might intervene to either forestall or accelerate that scenario. Having gone 25 years without an official period of recession, Australia certainly has lived up to its reputation as the "Lucky Country" through this point in time.
Update 30 March 2016 9:46 PM EDT: Steve Keen e-mails a clarification - the output variables in the tool above have been reidentified as nominal and real aggregate demand growth rates rather than as GDP growth rates. It's a subtle difference, but a distinct one that better describes the tool's output!
Previously on Political Calculations
- The Position, Velocity and Acceleration of Private Debt in the U.S.
- The Correlation Between Decelerating Debt and Falling GDP
- QE and the Acceleration of Private Debt in the U.S.
- Private Debt Decelerates in 2015Q3, Real U.S. GDP Follows
- Slowing Private Sector Debt and the Slowing Economy

Labels: debt, gdp, gdp forecast, recession, recession forecast, tool
Welcome to the blogosphere's toolchest! Here, unlike other blogs dedicated to analyzing current events, we create easy-to-use, simple tools to do the math related to them so you can get in on the action too! If you would like to learn more about these tools, or if you would like to contribute ideas to develop for this blog, please e-mail us at:
ironman at politicalcalculations
Thanks in advance!
Closing values for previous trading day.
This site is primarily powered by:

CSS Validation

RSS Site Feed

JavaScript
The tools on this site are built using JavaScript. If you would like to learn more, one of the best free resources on the web is available at W3Schools.com.
Other Cool Resources
Blog Roll


