It's something you probably wouldn't ever notice unless it were a problem, but hanging coats and other clothes take up a surprising amount of space.
How would that be a problem? If you lived anywhere space is a premium, such as an apartment without closets, you might find dedicating space just for hanging up your coats or clothes imposes a larger than expected penalty on you. Freestanding wardrobes are a traditional solution, but one that might take up too much of your limited floor space. The alternative solution of just tossing your clothes anywhere is really adding the problem of clutter to your living space without doing anything to solve the other problems you have.
When Simone Giertz moved to Los Angeles, she encountered these problems. They bothered her so much that she spent three years working up a unique solution for them: hinged, folding clothes hangers. In the following video she describes how she solved those problems:
She is in the process of turning her solution into a product you can buy, via a Kickstarter campaign that will run through Friday, 16 December 2023. She was seeking $50,000 in pledges but as of this writing, has received pledges in excess of $300,000, so the project is going to move forward and become a real product.
For us, she's provided a great example of outside the box thinking because her "Coat Hingers" do just that, with the boxes being either closets or wardrobes.
Labels: ideas, technology
What a difference a month and data revisions make!
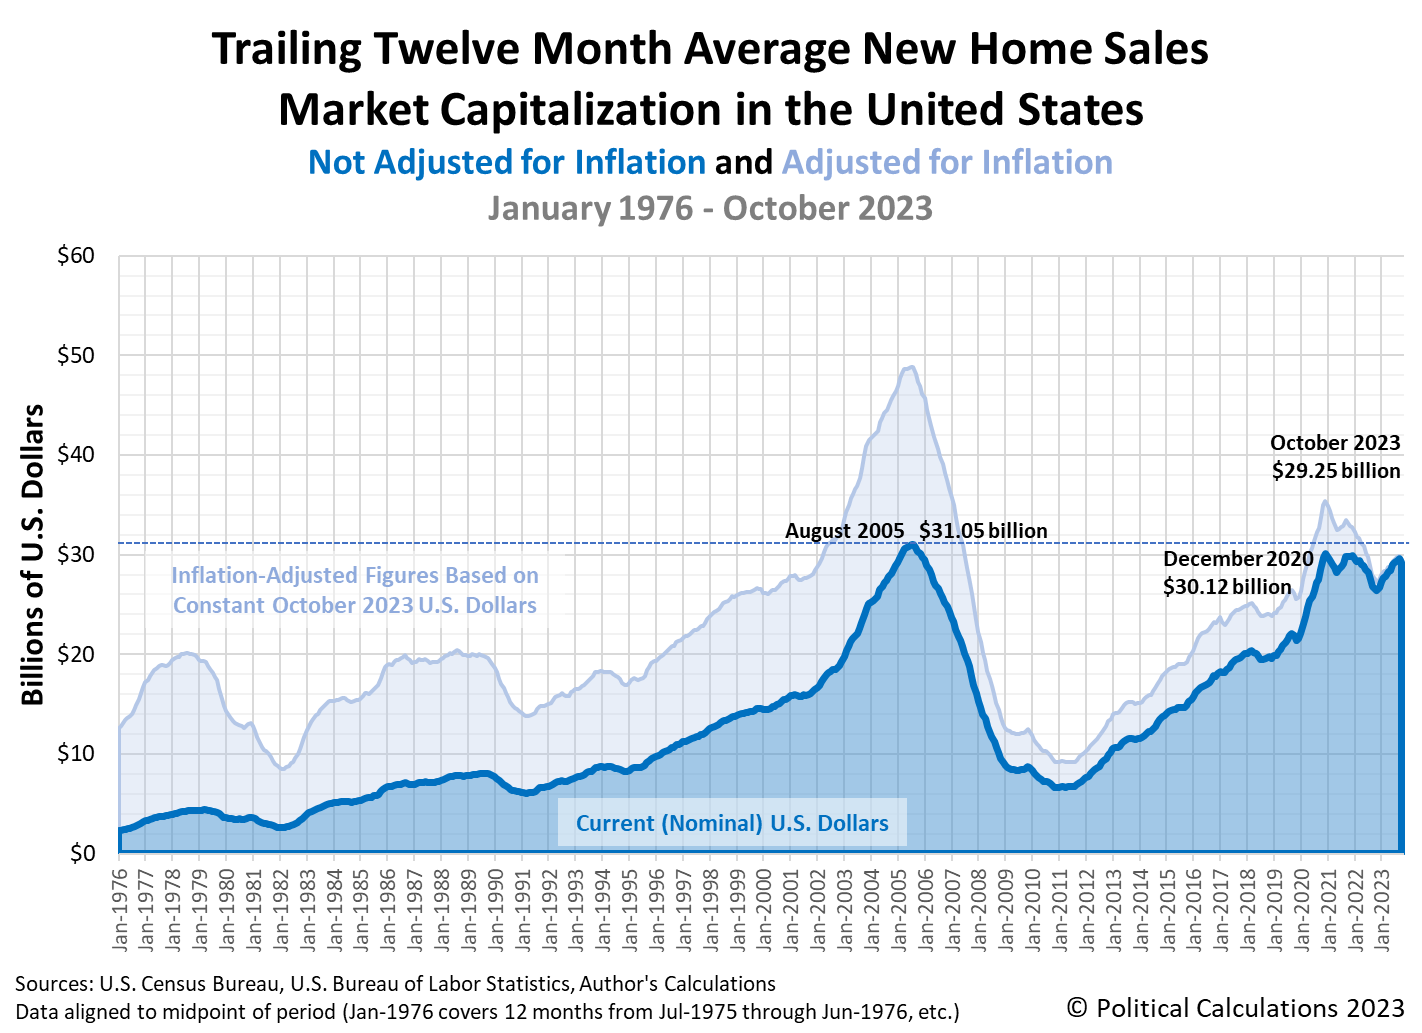
It was just a month ago that U.S. Census Bureau data on new home sales put the total value of all new homes sold during September 2023 within half a billion dollars of the $31.05 billion peak reached at the height of the U.S housing bubble in August 2005.
But downward revisions for the number of new homes sold in recent months combined with the falling average price of new homes sold has changed that picture. Political Calculations' initial estimate of the nominal (non-inflation adjusted) market capitalization of new homes sold during the month of October 2023 is $29.25 billion. That's below September 2023's revised estimate of $29.62 billion, which itself is a full billion below our initial estimate for that month.
So rather that being close to the August 2005 nominal peak, we find instead that the market cap of all new homes sold in the U.S. has yet to surpass their December 2020 pre-Biden era peak. The data for October 2023 is also the first to break what had been a series of consistently rising monthly values for this measure since November 2022, though it is too early to verify if that upward trend has been broken.
These figures will continue to be revised over the next several months, but for now, here is the latest update to our chart illustrating the market capitalization of the U.S. new home market since January 1976:
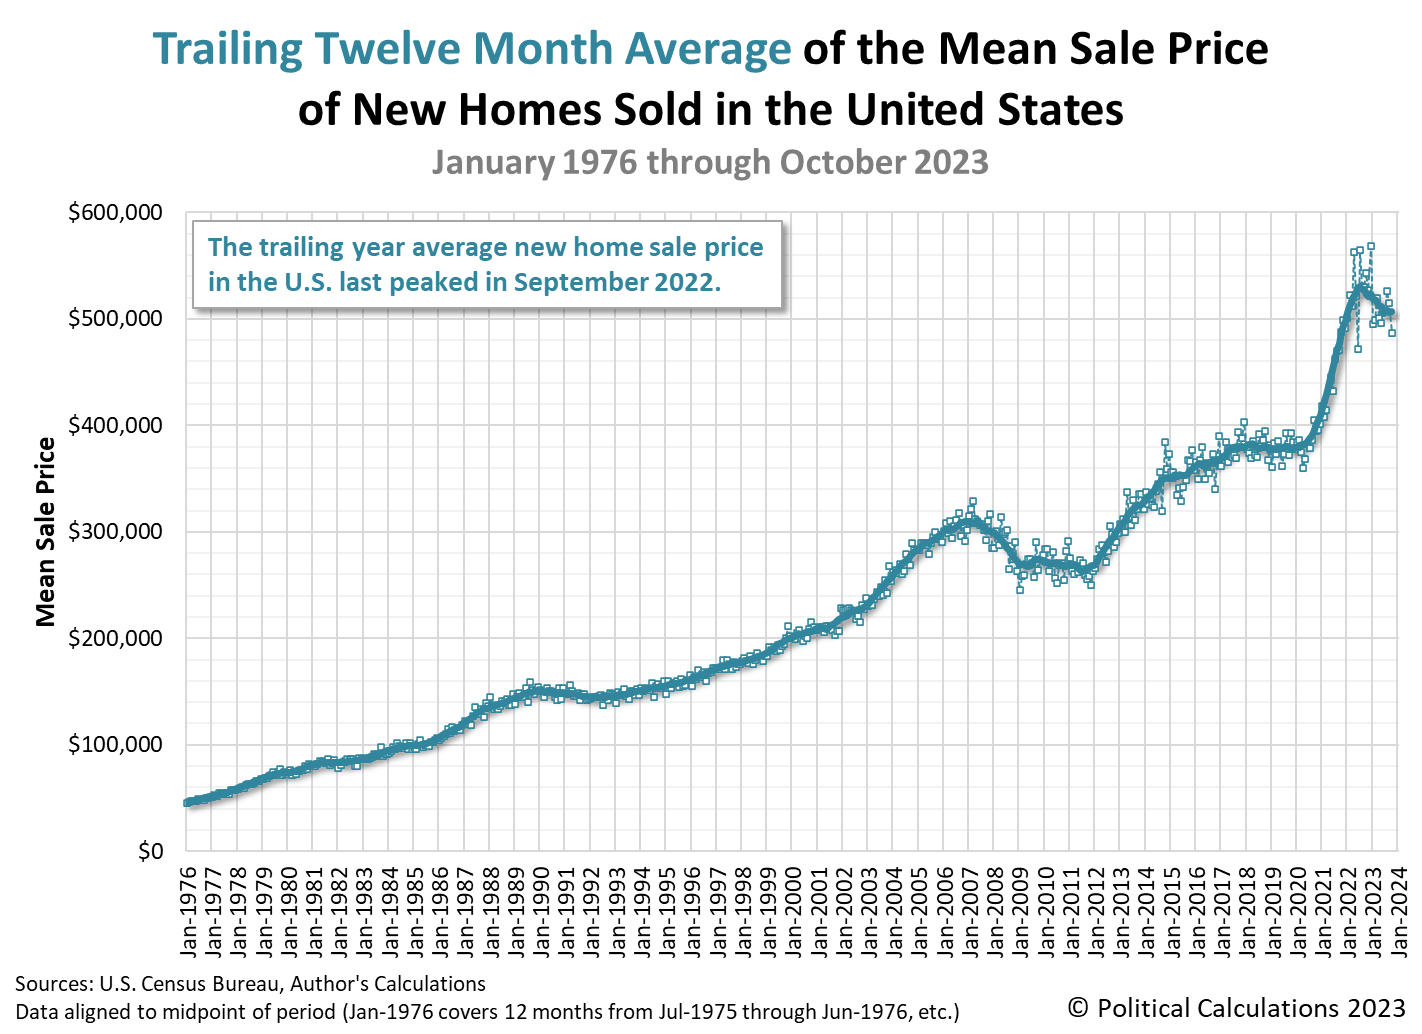
The next two charts show the latest changes in the trends for new home sales and prices:
There are negative implications for the market cap of new home sales to have begun falling in October 2023. Since new home sales contribute roughly 3-5% to the nation's Gross Domestic Product, a change from a rising to a falling trend would mean the market for new homes may now be contributing a headwind to the U.S. economy.
References
U.S. Census Bureau. New Residential Sales Historical Data. Houses Sold. [Excel Spreadsheet]. Accessed 27 November 2023.
U.S. Census Bureau. New Residential Sales Historical Data. Median and Average Sale Price of Houses Sold. [Excel Spreadsheet]. Accessed 27 November 2023.
Image credit: Microsoft Bing Image Creator. Prompt: "A picture illustrating the concept of prices rising over time. Digital art, 4k.".
Labels: real estate
Inflation indices like the Consumer Price Index (CPI) and the Producer Price Index (PPI) have been in the news a lot since inflation began running hot in the spring of 2021.
As their names suggest, these seasonally-adjusted indices provide a measure of the inflation experienced by different groups within the U.S. economy. The CPI represents the measure of inflation experienced by all U.S. urban consumers (about 93% of the population) and the PPI measures inflation experienced by U.S. businesses that either produce goods or provide services.
The Bureau of Labor Statistics reported what was considered to be positive news for both the CPI and the PPI inflation indices for the month of October 2023. The CPI was unchanged from its reported level in September 2023, although it was up 3.2% year-over-year. The PPI "unexpectedly" fell by 0.5% from its September 2023 level, but was still up by 1.3% year-over-year.
How is this information less than useful? To understand why, try answering these two questions using the information presented in the previous paragraph:
- How will the CPI and PPI change from October to November 2023?
- How will the CPI and PPI change from October 2023 to October 2024?
If you're in the business of looking forward, as many analysts and business managers have to be because they're making decisions and plans about what to buy or what multi-million dollar investments to make, this information tells you virtually nothing about where inflation is heading. Their getting the answer wrong can cause big losses and/or jobs.
In 2010, money manager Barry Ritholtz slammed the CPI in particular and explained why to Time's Justin Fox:
Another we have to look at as not helpful at all is CPI. Thanks to the Boskin Commission, it has been rendered more or less meaningless. He (economist Michael Boskin) deserves credit for taking an otherwise valid economic indicator and pissing all over it. (Here’s Barry going on at length about his disdain for Boskin.)
Meanwhile, Moody's economist Mark Zandi faulted the usefulness of the PPI, grouping it with other economic indicators he described as "either often misleading or the signal to noise ratio is very high and thus hard to interpret". (Note: That's a verbatim quote. Zandi most likely meant the noise-to-signal ratio was very high for the indicators he cited, as that would be a bad thing for getting a good reading on the direction of the economy.)
Speaking of which, did you know the Federal Reserve, which is chartered with the jobs of providing for price stability and maximizing the number of jobs in the U.S. economy, doesn't have a good understanding of inflation? Here's how former Fed governor Daniel K. Tarullo put it in a 2017 paper:
The substantive point is that we do not, at present, have a theory of inflation dynamics that works sufficiently well to be of use for the business of real-time monetary policy-making.
It's not like the Fed doesn't have inflation data, as the CPI and PPI are just two measures of it. But it's clear doing anything useful with the information provided by the inflation indices is something of a problem for the people who have to be the most on top of it.
The CPI and PPI data reported to the public feeds into future expectations for inflation, and as Barry Ritholtz colorfully put it earlier this year, "inflation expectations are useless":
They aren’t merely lagging, backward-looking indicators, but instead, inform us as to what the public was experiencing about 3-6 months ago. Typically, it takes people a few weeks or months to subconsciously incorporate broad, subtle changes into their internal mental models, and longer to consciously recognize those nuanced shifts.
Beyond short-term trend extrapolation, inflation expectations have little to no ability to provide insight into the intermediate-future (e.g., 6-12 months) inflation. As to the longer-term, the 5-Year Forward Inflation Expectation Rate are ridonkulously, hilariously, laughably useless. They are so silly as to be “Not even wrong” — just goofy irrelevant guesses.
Meanwhile, Bloomberg Markets' Mark Cudmore takes aim at another frequently reported measure of inflation expectations that doesn't track with the CPI:
The inflation expectations reading from the University of Michigan is again being cited as a relevant input. It’s not. Anyone who is allowed to touch any of the real buttons in a trading room should ignore it.
It’s completely useless, not just as a guide to levels, but even directionally. No amount of data-mining can validate any useful signal from the reading since the inflation regime changed several years ago.
A 2021 paper by the Federal Reserve Board's Jeremy Rudd confirms the Fed's analysts have little-to-no confidence in the inflation expectations data.
Economists and economic policymakers believe that households’ and firms’ expectations of future inflation are a key determinant of actual inflation. A review of the relevant theoretical and empirical literature suggests that this belief rests on extremely shaky foundations, and a case is made that adhering to it uncritically could easily lead to serious policy errors.
As economic indicators, inflation indices are backward-looking metrics that are not useful for divining where inflation will go in the future. To the extent they are useful, it is as a means of quantifying how prices changed in the past. Inflation expectations data doesn't even have that going for it.
Previously on Political Calculations
- Less Than Useful Data in the World of Big Data
- Less Than Useful Data: Consumer Confidence
- Less Than Useful Data: FHFA House Price Index
- Less Than Useful Data: Index of Leading Economic Indicators
- Less Than Useful Data: Weekly Chain Store Sales
- Less Than Useful Data: Challenger Layoff Announcements
- Less Than Useful Data: ADP Employment Index
- Less Than Useful Data: Inflation Indices
Image credit: Microsoft Bing Image Creator. Prompt: "A picture illustrating the concept of prices rising over time. Digital art, 4k."
Labels: ideas
Welcome back from the Thanksgiving holiday! We're pleased to confirm that not much happened to affect stock prices during the week that was, so if you took the entire week off, you really didn't miss much.
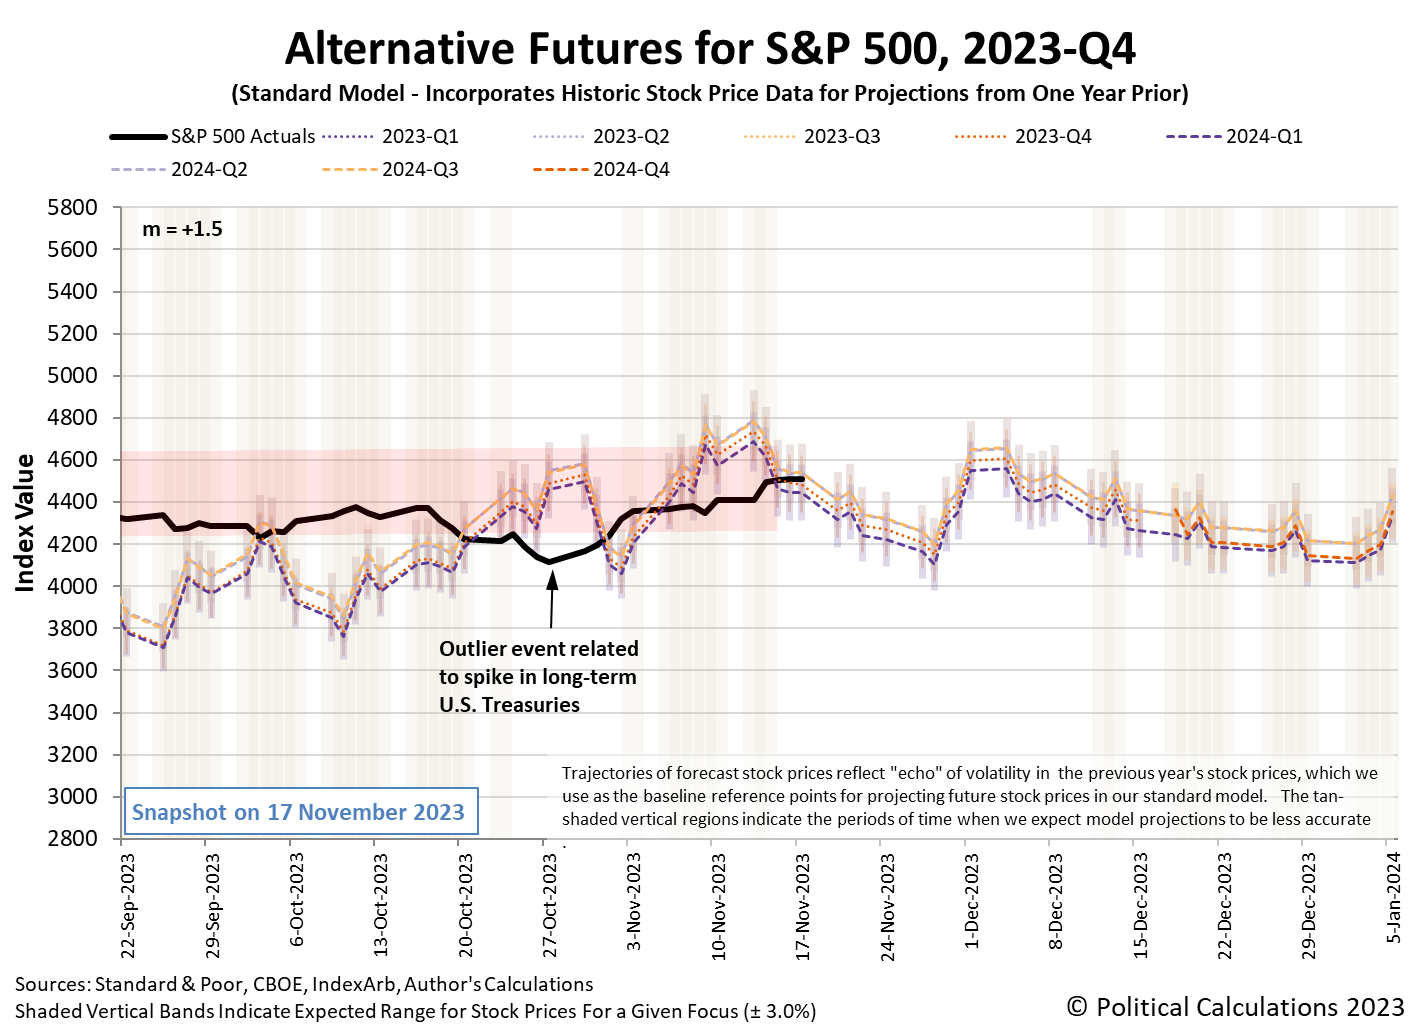
That's because there was little news originating in the U.S. to give markets a convincing direction during the past week. The Thanksgiving holiday-shortened trading week saw the S&P 500 (Index: SPX) close at 4559.34, up 1.0% from the previous week's close.
For the latest update of the alternative futures chart, we find the index is continuing to follow a flat-to-slightly rising trajectory. That puts it above the unadjusted dividend futures-based model's short term projections, but that's only because we've chosen to not extend the redzone forecast range to account for the short term echo from October 2023's outlier noise event.
That echo effect is a result of the dividend futures-based model's use of historic stock prices as the base reference points from which it projects the future for the S&P 500. Those base reference points are taken from the S&P 500's value some 13 months, 12 months, and 1 month earlier. October 2023's short-term spike in long-term U.S. Treasury rates occurred just one month ago, so the model's raw projections are being skewed by the volatility in stock prices at that time. The echo will stop affecting the model's projections in one week, coinciding with its dissipation.
Our summary of the past week's market-moving headlines is blissfully short:
- Monday, 20 November 2023
-
- Signs and portents for the U.S. economy:
- BOJ minions counting on Japanese firms giving out big raises to end never-ending stimulus:
- Bigger trouble developing in the Eurozone:
- Germany heading for another poor quarter, "arduous" recovery: Bundesbank
- Poor euro zone bank valuations seen a drag on credit growth: ECB
- ECB minions signal they're ready to sit on their hands:
- Nasdaq leads Wall Street gains as Microsoft hits record
- Tuesday, 21 November 2023
-
- Signs and portents for the U.S. economy:
- Oil edges lower on caution ahead of OPEC+ meeting
- US existing home sales slump to more than 13-year low, prices accelerate
- Fed minions say they'll stay hawkish on inflation, start to see other problems:
- 'Hawkish' FOMC Minutes: Warn On Fading Consumer, Financial System Stability Risks
- Fed shifts into cautious policy mode as risks become more two-sided
- Bigger stimulus developing in China:
- BOJ minions see return of inflation, consider ending never-ending stimulus:
- ECB minions worried about inflation, drag from real estate on Eurozone banks:
- ECB says property slump could last years in threat to lenders
- ECB's Lagarde warns against premature inflation celebration
- Eurozone government minions want less spending next year:
- S&P 500, Nasdaq close down, ending 5-session winning streaks; retailers, tech weak
- Wednesday, 22 November 2023
-
- Signs and portents for the U.S. economy:
- OPEC+ postpones policy meeting to Nov 30, oil falls
- US mortgage interest rates fall to two-month low
- US durable goods orders fall on weakness in transportation equipment sector
- Bigger stimulus developing in China:
- Majority of economists want BOJ minions to end never-ending stimulus next year:
- ECB minions starting to think they might be done with rate hikes and may need to start cutting them instead:
- ECB's Nagel: rates at peak or close, rules out hard landing
- ECB's Centeno sees conditions to reverse rate cycle 'in the near future'
- Nasdaq, S&P, Dow post pre-Thanksgiving gains; yields rise while oil pares losses
- Friday, 24 November 2023
-
- Signs and portents for the U.S. economy:
- Oil settles lower but notches weekly gain ahead of OPEC+ decision
- White House stalls ethanol expansion in Midwest amid price concerns
- Bigger trouble developing in China:
- China launches social security fund-backed $707 million investment fund in Shanghai
- How to save China’s economy
- Bigger trouble developing in Japan:
- Japan's factory activity shrinks for 6th month on weak demand - PMI
- Japanese inflation picks up as BOJ pivot bets grow
- Bigger trouble developing in the Eurozone:
- ECB minions told to "resist urge" to cut rates sooner:
- Wall St ends mixed in truncated Black Friday trading
The CME Group's FedWatch Tool continues to expect the Fed will hold the Federal Funds Rate steady in a target range of 5.25-5.50% through next April (2024-Q2). Starting from 1 May (2024-Q2), investors expect deteriorating economic conditions will force the Fed to start a series of quarter point rate cuts at six-to-twelve-week intervals through the end of 2024, unchanged from their expectations of a week earlier.
The Atlanta Fed's GDPNow tool's estimate of real GDP growth for the current quarter of 2023-Q4 ticked back up to +2.1% from last week's projected +2.0% annualized growth.
Image credit: Angry Bull photo by Carlos ZGZ on Flickr. Public domain image. Creative Commons CC0 1.0 DEED.
It's officially "Black Friday" in the U.S. This is the traditional day that those who get an extra day off work following Thursday's official Thanksgiving holiday use to start the mad rush of shopping for Christmas presents.
Which brings us to a problem that only a select number of shoppers have. What can you get for those people you know who really like maths?
In previous years, we've recommended maths-inspired objects like Klein bottles and oddly shaped objects that roll smoothly, which certainly make for unique gifts. This year, we're going to suggest something that's both a unique item and highly interactive. A card game based on blackjack, or Twenty-One, that takes the old-fashioned game to a new level.
21X is a new card game developed by Naylor Games that was successfully kickstarted in the U.K. earlier this year. Here's how the creator's described the game:
21X is a light, fast paced card game that fuses Blackjack with algebra.
Like Blackjack, you'll be dealt 2 cards with the objective of getting them to add up to 21. However, the cards you're being dealt, have a twist to them... they're algebraic formulas!
It's a perfect gift for maths loving friends and family members, a fun algebra learning tool for schools and fantastic for avid newspaper puzzlers.
We know the mere mention of the word "algebra" is enough to scare many, but check out the following less-than-three minute long preview from Board Game Happy, which provides a very quick lesson in how to play it:
Here are the written rules from 21X's Kickstarter site:
Most cards feature N, X or both on them. N is equal to the number of cards you have, while X can be any integer of your choice (except 0). X must be the same across all your cards and you can change it at any time.
Everyone plays simultaneously to try to get 21 first. At any time a player can "twist" and draw another card from the deck. This could help them, but will make N bigger in the process.
If a player makes 21, they announce it, state their X value and show their working. If they're correct, they win!
Alternatively, if a player can't make 21 but is close, they can call "stick" and state their X value (you may not stick or win with exactly 20). This gives all other players just 1 minute to beat that score. Whoever is closest to 21 at the end of the timer, wins!
Unfortunately, since 21X was only just successfully kickstarted as of 19 October 2022, it won't be available until June or July 2024, which takes it off 2023's shopping list for gift-giving. For now, you can subscribe for pre-order notification at Naylor Games' site to get well ahead of the game when Black Friday 2024 rolls around.
But that still leaves the question of what gift might work for that maths-oriented person you know in 2023, and that's where the Kickstarter site offers useful inspiration. For those pledging support for the project, Naylor Games offered a discounted copy of Marcus du Sautoy's new book, Around the World in Eighty Games: From Tarot to Tic-Tac-Toe, Catan to Chutes and Ladders, a Mathematician Unlocks the Secrets of the World's Greatest Games.
If you're not familiar with du Sautoy, he presented the series A Brief History of Mathematics on the BBC in 2010. The 10 episodes of that series are freely available for download and provides a fantastic overview of who did what and when in maths.
His new book explores the centuries-long connections between maths and games, which makes it almost self-recommending for anyone who enjoys both. We're looking forward to it and also to playing 21X sometime in 2024!
Louis Weisz achieved internet immortality in 2021 when he cooked a chicken by slapping it. Or more accurately, building a slapping machine that converted kinetic energy into enough heat to cook a chicken from repeatedly striking it.
But would that technology work to cook a turkey? In the following less than 22-minute video, he finds out not only if he can but whether the final result is worthy of being eaten as part of a Thanksgiving dinner!
The consensus among his guests? It's tastes like turkey!
Being traditionalists, we'll stick with more familiar turkey cooking methods, but if you go for the slapping method, the IIE team wishes you a Happy Slapsgiving!
From the Inventions in Everything Archives
Here's a sampling of other inventions involving turkeys, unique kitchen gadgets, and devices capable of delivering a slap!
- Solving Crimes with Turkey DNA Evidence
- Invention in Everything: The Truly Boneless Thanksgiving Turkey
- Inventions in Everything: A Pat on the Back
- Inventions in Everything: A Five-in-One Kitchen Multitasker
- Inventions in Everything: Ice Cream Pint Lock
- Inventions in Everything: The Flask from the Future
- Inventions in Everything: Stopping the Refrig-a-raider
- Inventions in Everything: Suction Tube for Reverse Axial Withdrawal
- The Kitchen Unitaskers You Cannot Live Without
- Inventions in Everything: Geothermal Beer Coolers
- Inventions in Everything: The Ultimate Turkey Blind
Labels: technology, thanksgiving
The American Farm Bureau Federation reports the cost of providing a traditional Thanksgiving turkey dinner for 10 people in 2023 is 4.5% lower than it was in 2022. The identical grocery items that cost $64.05 a year ago now cost $61.17 according to the Farm Bureau's annual shopping survey.
But as you'll see in the following chart, the cost of that traditional Thanksgiving dinner is still well elevated above what it was in 2020.
There's a lot of information in the chart showing how prices for the ten items of the AFBF's Thanksgiving dinner shopping list has changed in each year since 2020. We've used clustered columns along its horizontal axis to indicate the annual average price paid for each of the individual items, which are ranked according to their 2021 cost. We've also presented a cumulative cost curve for each year to show how each item adds to the total meal cost that is arrived at on the right-hand side of the chart.
Presenting the data this way lets us see that the increase in the cost of turkey is once again responsible for most of the year-over-year change in the cost of the meal. Here we see the cost of a 16-pound bird declined by 5.6% to $27.35 in 2023. That decline is attributable to the rebound from the negative impact of 2022's avian influenza epidemic on the supply on turkeys during 2022.
Unlike 2022, when only the price of cranberries fell from what they cost the previous year, 2023 saw a larger number of price declines among the items on the AFBF's shopping list. In addition to turkey, the prices for milk, cranberries, pie shells, cubed stuffing, whipping cream, and green peas were lower than their 2022 prices. Altogether, these items saw their prices collectively fall by $3.18.
Meanwhile, the prices of the 1-pound veggie tray, rolls, sweet potatoes, and pumpkin pie mix rose by a combined $0.30. The total net change is a reduction of $2.88, of which the $1.61 decline in the price of a 16-pound turkey is the biggest component, accounting for 56% of the year-over-year difference.
From 2011 through 2020, the cost of a traditional Thanksgiving dinner held steady within a relatively narrow range between $46.90 (2020) and $50.11 (2015). The cost of a traditional Thanksgiving dinner for 10 people remains 30% higher than 2020's level thanks largely to President Biden's inflation.
References
American Farm Bureau Federation. Farm Bureau: Survey Shows Thanksgiving Dinner Cost Up 14%. [Online Article]. 18 November 2021.
American Farm Bureau Federation. Thanksgiving Dinner Cost Survey: 2022 Year to Year Prices. [PDF Document]. 17 November 2022.
American Farm Bureau Federation. Thanksgiving Dinner Cost Relief, But Still High Relative to Recent Years. [Online Article]. 15 November 2023.
Image Credit: Thanksgiving Dinner. Public domain image by U.S. Department of Health and Human Services via U.S. Census Bureau.
Labels: food, inflation, personal finance, thanksgiving
In 2022, American poultry farmers were in crisis.
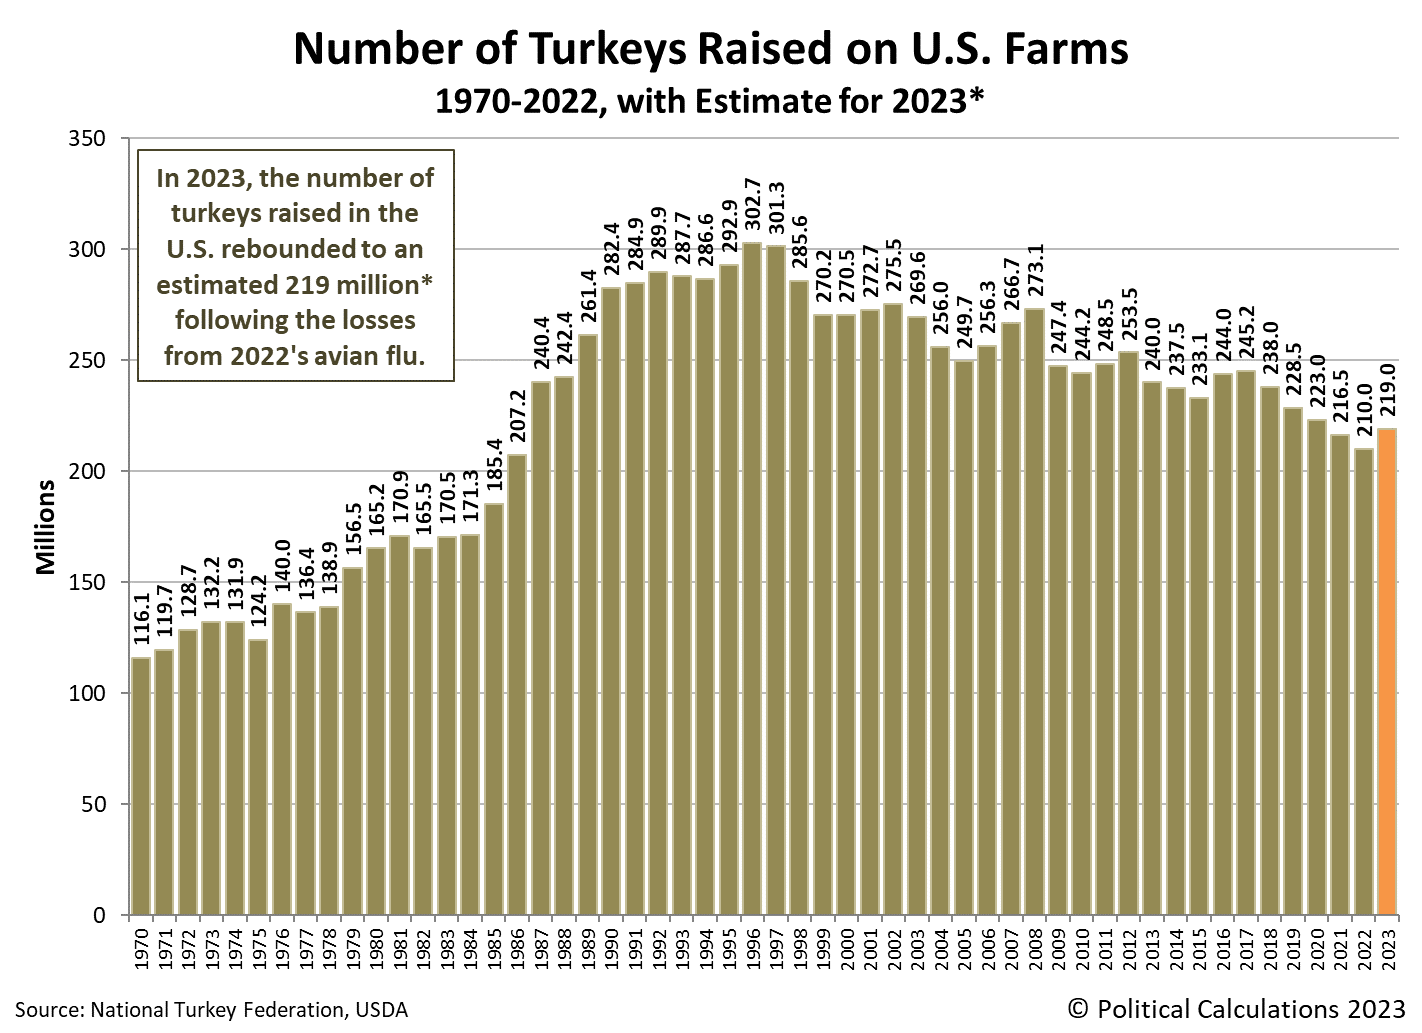
Thanks to outbreaks of Highly Pathogenic Avian Influenza (HPAI), entire flocks of chickens and turkeys on U.S. farms had to be culled to limit the spread of the highly infectious and deadly virus in early 2022. Before its spread abated, HPAI claimed the lives of approximately 36 million chickens, turkeys, and other game birds raised on U.S. farms. Among U.S. turkey producers, the population of turkeys plummeted from 216.5 million in 2021 to 210 million in 2022.
But in 2023, the domesticated turkey population rebounded to an estimated 219 million. That puts the number of turkeys raised in the United States back up the the level it was between 2020 and 2021.
That's also the third-lowest figure recorded since 1987, when the low-fat diet craze of the 1980s prompted a surge of demand for turkey among American consumers. It is also generally in line with the downward trend that has been in place since 1996, when the population of farm-raised turkeys peaked at 302.7 million.
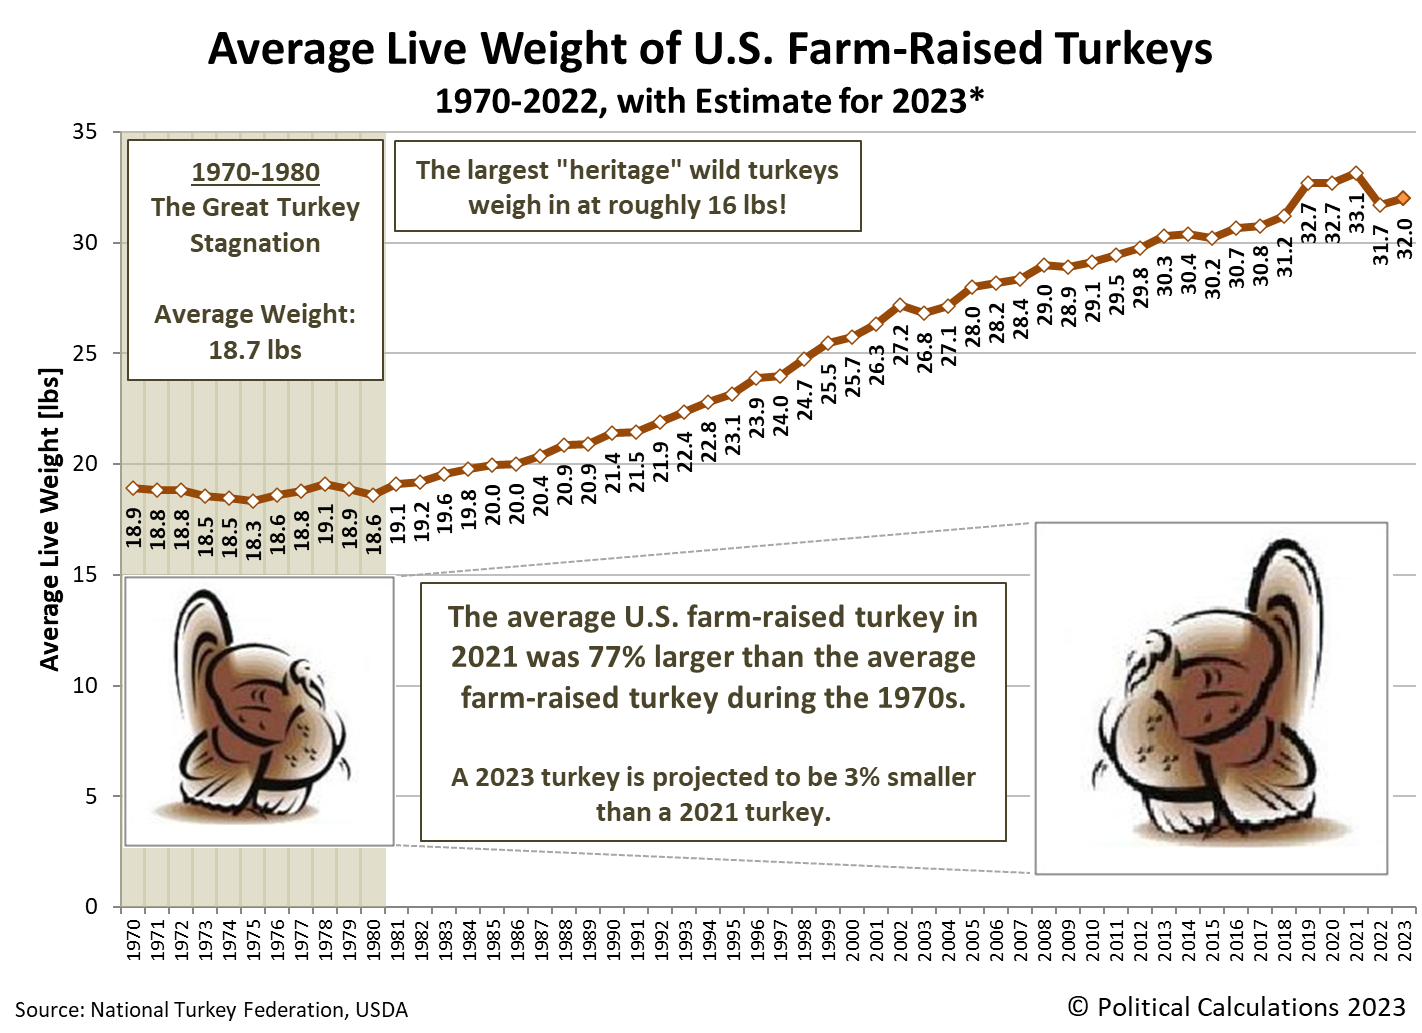
The U.S. Department of Agriculture estimates the average weight of a live turkeys being raised on U.S. farms in 2023 is 32.0 pounds (14.5 kg). That figure is up from the 31.7 pounds (14.4 kg) recorded in 2022, but falls a little over three percent below the record average live weight of 33.1 pounds (15.0 kg) set in 2021.
Assuming that average live weight estimate holds, the combined live weight of all turkeys raised in the U.S. during 2023 will total a little over 7 billion pounds (3.175 billion kg). That 5.3% increase from 2022's figure would be the fourth lowest annual total of the period since 1996, when U.S. turkey production first exceeded the 7.0 billion pound threshold.
The American Farm Bureau Federation puts the price of a 16-pound (7.26 kg) ready-to-cook turkey at $27.35 in 2023, which is down 5.6% from 2022's cost of $28.96. That figure however is over 41% more expensive than the $19.39 American consumers paid for the same size turkey in 2020.
Stay tuned for our next entry, when we'll look at the changing cost of a traditional Thanksgiving dinner since 2020.
References
U.S. Department of Agriculture. Turkeys Raised. [PDF Document]. 27 September 2023.
U.S. Department of Agriculture. Meat statistics tables, recent. Table 3 - Livestock and poultry live and dressed weights. [Excel Spreadsheet]. 27 October 2023.
U.S. Department of Agriculture. Poultry - Production and Value. 2022 Summary. [PDF Document]. April 2023.
U.S. Department of Agriculture. World Agricultural Supply and Demand Estimates (WASDE - 642). U.S. Quarterly Animal Product Production. Nov Proj. Turkey (Ready To Cook Weight, millions of pounds). [PDF Document]. 9 November 2023.
Image credit: Microsoft Bing Image Creator. Prompt: "farm turkeys, photograph, highly detailed, photorealistic, 4k, digital art concept".
Labels: food, thanksgiving, turkey
The S&P 500 (Index: SPX) had one of its best weeks in 2023. The index rose nearly 2.2% to 4510.54. Since bottoming on 27 October 2023, the index has flirted with recording its fastest comeback ever after going into a correction, rising 9.5% in the weeks since.
There is one and only one story behind the past week's rise in stock prices. The October 2023 consumer price inflation report released on Tuesday, 14 November 2023 came in slightly lower than expected with indications U.S. inflation will continue trending downward. That change was enough to take the prospect of additional rate hikes by the Federal Reserve off the table, at least for the near-term, which boosted the outlook for publicly-traded companies in the U.S.
Other market-moving news headlines during the week did little to alter that updated expectation, with the outcome being seen as a jump in the S&P 500 on Tuesday followed by a relatively flat trajectory for stock prices afterward. The latest update to the dividend futures-based model's alternative futures chart captures that action:
Here is our summary of the week's market moving news headlines.
- Monday, 13 November 2023
-
- Signs and portents for the U.S. economy:
- Oil settles up 1% as OPEC report dampens demand concerns
- US retailers stuck with excess stock offer bargains as holiday season nears
- U.S. manufacturing has plateaued after post-pandemic rebound: Kemp
- Bigger trouble developing in Asia, Pacific region:
- Signs of stimulus gaining traction in China:
- BOJ minions get some good news for a change:
- S&P 500 takes a pause ahead of U.S inflation data
- Tuesday, 14 November 2023
-
- Signs and portents for the U.S. economy:
- Slowing US inflation boosts hopes Fed done with rate hikes
- Oil up 1% as IEA lifts demand growth forecast, US inflation cools
- Fed minions expected to start cutting rates in May 2024:
- Bigger trouble developing in China:
- BOJ minions thinking about really ending never-ending stimulus:
- Bigger trouble developing in the Eurozone:
- Nasdaq posts best day since April; S&P, Dow also rise as stocks rip big gains after CPI
- Wednesday, 15 November 2023
-
- Signs and portents for the U.S. economy:
- Oil prices dive on big US crude stock build, record output
- US economy cools as retail sales dip, monthly producer prices decline
- Bigger stimulus, mixed economic growth signs developing in China:
- China central bank boosts liquidity injection through policy loan, rate unchanged
- China's factory output, consumption beat forecasts but property still a drag on economy
- Bigger trouble developing in Japan, as BOJ minions signal end may come next year for never-ending stimulus:
- Japan's economy contracts as recession risks grow
- Analysis-BOJ's hawkish rhetoric signals chance negative rates may end soon
- Bigger trouble developing in the Eurozone:
- Nasdaq, S&P, Dow close in the green as more economic data fuels soft landing hopes
- Thursday, 16 November 2023
-
- Signs and portents for the U.S. economy:
- Santa's sleigh to be lighter as people buy fewer toys
- Investment funds stocking up on US farmland in safe-haven bet
- Oil prices slip on US crude build and China demand worries
- Mortgage rates fall for a third week - Freddie Mac
- US labor market loosening as weekly jobless claims hit three-month high
- US import prices post largest drop in seven months
- Fed minions create uncertainty about their next actions, but say they'll keep shrinking their balance sheet:
- Fed's Cook says economic risks two-sided, 'soft landing' possible
- Exclusive-Three Fed governors tell US senator there is room to reduce balance sheet
- Bigger trouble, stimulus developing in China:
- China's not-so-special economic zone embodies a harsh new reality
- China's home prices dip for 4th month, may weaken further
- China to step up efforts to attract FDI, boost consumption - state planner
- Bigger trouble developing in Japan:
- Cisco, Walmart drag down Nasdaq, S&P, Dow; yields fall as traders parse economic data
- Friday, 17 November 2023
-
- Signs and portents for the U.S. economy:
- Fed minions are apparently meditating about many things:
- Fed officials find a bit of Zen on way to next policy decision
- Fed's Collins: Not ready to say the rate hike cycle is over
- Fed's Barr says tougher capital plan would have limited impact on borrowing costs
- Fed's Goolsbee expects easing shelter inflation to seal path to 2%
- Boston Fed's Collins: Central bank needs better view of full employment
- Bigger trouble developing in Brazil:
- BOJ minions say they won't consider stopping never-ending stimulus until they hit 2% inflation target:
- BOJ will debate easy-policy exit when inflation nears target -Gov Ueda
- Japan Oct CPI seen accelerating, staying above BOJ's target: Reuters poll
- Bigger inflation developing in the Eurozone, ECB minions focusing on lowering their cost of paying interest on bank reserves, don’t want anyone to think they might cut rates soon:
- More expensive services, food drive euro zone inflation in Oct
- ECB's Nagel calls for cut in interest paid on bank reserves
- ECB hawks push back on early rate cut bets
- S&P 500 closes up slightly, traders digest earlier gains, Fed comments
The CME Group's FedWatch Tool anticipates the Fed will hold the Federal Funds Rate steady in a target range of 5.25-5.50% through next April (2024-Q2). Starting from 1 May (2024-Q2), investors expect deteriorating economic conditions will force the Fed to start a series of quarter point rate cuts at six-to-twelve-week intervals through the end of 2024, which is six weeks earlier than expected a week ago.
The Atlanta Fed's GDPNow tool's estimate of real GDP growth for the current quarter of 2023-Q4 dipped slightly to +2.0% from the +2.1% annualized growth it projected a week ago.
Image credit: Prompt: Microsoft Bing Image Creator. "bull running out of a gate, golden hour, nikon 35, highly detailed, photorealistic, 4k".
Oliver Elfenbaum explains how the stock market started, what it is and how it works in the following four-and-a-half-minute long video.
Obviously, there's a lot more to it, but Elfenbaum provides a marvelously brief introduction that highlights the basics.
Previously on Political Calculations
Labels: dividends, ideas, stock market, stock prices
Every three months, we take a snapshot of the expectations for future earnings in the S&P 500 (Index: SPX) at approximately the midpoint of the current quarter, shortly after most U.S. firms have announced their previous quarter's earnings.
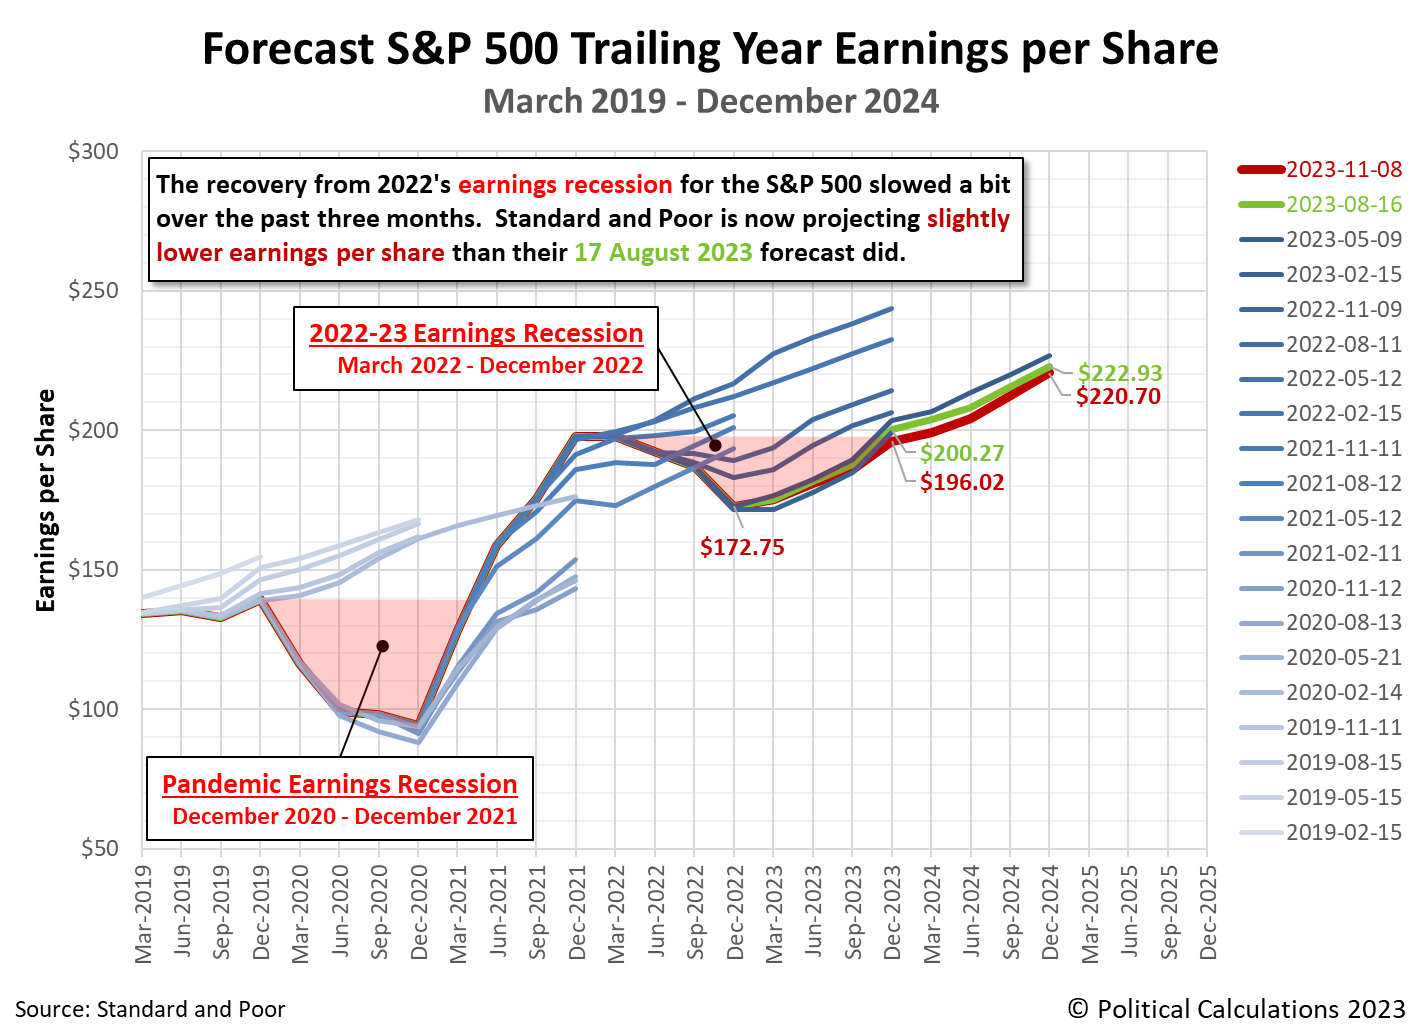
Since our last update three months ago, expectations for the S&P 500's earnings have dipped by a small amount. Expectations for the index' future earnings per share through the end of 2023 has decreased from $200.27 to $196.02.
That's almost enough to mark a full recovery from 2022's earnings recession in the fourth quarter of 2023. Given current projections, we believe that threshold will be properly crossed very early in 2024-Q1.
The following chart illustrates how the latest earnings outlook has changed with respect to previous snapshots:
Standard and Poor's projections through the end of 2024 indicates a smaller decline in thie index' earnings per share through that point of tme. They show the S&P 500's earnings per share decreasing from $222.93 to $220.70.
About Earnings Recessions
Depending on who you talk to, an earnings recession has one of two definitions. An earnings recession exists if either earnings decline over at least two consecutive quarters or if there is a year-over-year decline over at least two quarters. The chart identifies the periods in which the quarter-on-quarter decline in earnings definition for an earnings recession is confirmed for both the Pandemic Earnings Recession (December 2020-December 2021) and the new earnings recession (March 2022-December 2022) according to the first definition. The regions of the graph shaded in light-red correspond to the full period in which the S&P 500's earnings per share remained below (or are projected to remain below) its pre-earnings recession levels.
Using the slighly different measure of year-over-year growth rate, analysts at Raymond James are signaling the S&P 500's earnings recession is officially over. Here's the story from Markets Insider:
Our Chart of the Day is from Raymond James, which shows that the S&P 500's earnings recession has officially ended.
So far, 92% of S&P 500 companies have reported their third-quarter earnings results. Of those companies, 82% beat profit estimates by a median of 7%, while 59% beat sales estimates by a median of 3%, according to data from Fundstrat.
The results put the S&P 500 on track to see third-quarter year-over-year profit growth of 5%, which is well ahead of analysts estimates for flat growth just four months ago.
There is a difference in terminology for what Raymond James' analysts are describing with respect to what we are tracking. We follow Standard & Poor's example of identifying earnings according to the quarter in which they are reported, while Raymond James identifies them by the calendar quarter in which they occurred. What they identify as 2023-Q3 earnings is what we would identify as belonging to 2023-Q4.
That descriptive difference aside, Standard & Poor's earnings estimates as of 8 November 2023 put 2023-Q4's year-over-year earnings growth rate just ever-so-slightly below water. They are very much on track to record positive year-over-year growth in 2024-Q1.
Our next snapshot of the index' expected future earnings will be in three months.
Reference
Silverblatt, Howard. Standard & Poor. S&P 500 Earnings and Estimates. [Excel Spreadsheet]. 8 November 2023. Accessed 8 November 2023.
Labels: earnings, forecasting, SP 500
The outlook for S&P 500 (Index: SPX) quarterly dividends per share continued to improve during the month since our first snapshot of the future for the index' dividends per share through each quarter of 2024.
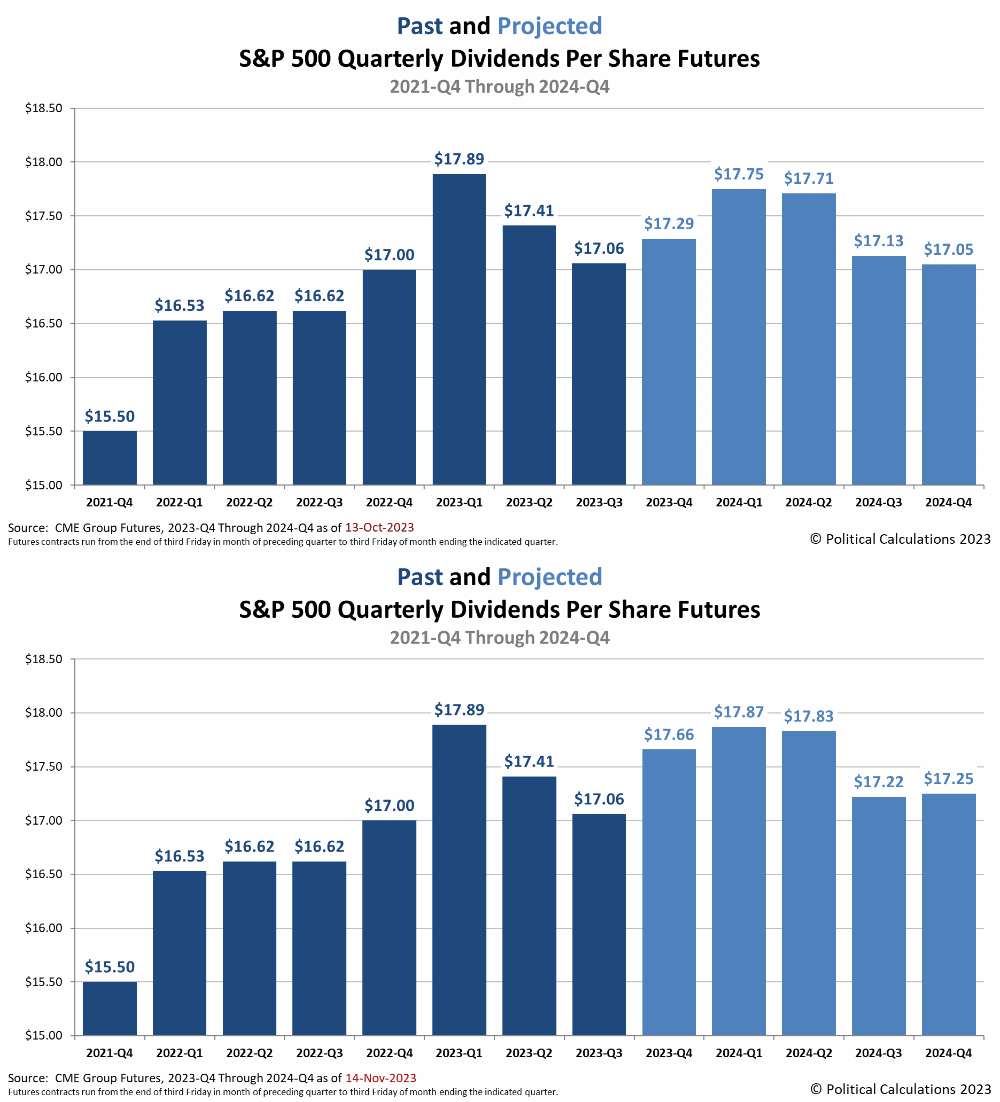
In between then and now, the outlook dimmed as long term interest rates spiked at the end of October 2023 before brightening in the weeks since. Going into the 14 November 2023 trading day, projected dividends have risen for each quarter from the current 2023-Q4 through 2024-Q4.
We captured the snapshot before the better-than-expected U.S. consumer price inflation report was released on 14 November 2023, so we have a good baseline from which to see how the accompanying changes in expectations affects the outlook for S&P 500 dividends per share plays out in future updates. As for how things have changed since our previous update, here is an animated chart providing that information.
For the current quarter of 2023-Q4, the amount of dividends expected to be paid out over the life of the quarter's dividend futures contracts increased by 2.1% from $17.29 per share to $17.66 per share. This change corresponds with the improvements we've generally seen as the recovery from the S&P 500's 2022 earnings recession has progressed.
Although the outlook brightened for each future quarter in our field of view, there remains a dark cloud on the time horizon for investors. The drop in expected dividends per share for the S&P 500 index between 2024-Q2 and 2024-Q3 is substantial. Since quarterly dividends are a mildly lagging-to-contemporary economic indicator, that dropoff suggests investors anticipate a rough experience for dividend-paying firms arriving in or by 2024-Q2. That timing coincides with when investors are betting the Federal Reserve will be forced by worsening economic conditions to start cutting interest rates.
We'll take our next regularly scheduled snapshot of the outlook for the S&P 500's quarterly dividends per share in three months, although we'll revisit the future for S&P 500 dividends with a special edition if anything exciting happens with them before that time.
More About Dividend Futures Data
Dividend futures indicate the amount of dividends per share to be paid out over the period covered by each quarter's dividend futures contracts, which start on the day after the preceding quarter's dividend futures contracts expire and end on the third Friday of the month ending the indicated quarter. So for example, as determined by dividend futures contracts, the now "current" quarter of 2023-Q4 began on Saturday, 16 September 2023 and will end on Friday, 15 December 2023.
That makes these figures different from the quarterly dividends per share figures reported by Standard and Poor. S&P reports the amount of dividends per share paid out during regular calendar quarters after the end of each quarter. This term mismatch accounts for the differences in dividends reported by both sources, with the biggest differences between the two typically seen in the first and fourth quarters of each year.
Labels: dividends, forecasting, SP 500
Welcome to the blogosphere's toolchest! Here, unlike other blogs dedicated to analyzing current events, we create easy-to-use, simple tools to do the math related to them so you can get in on the action too! If you would like to learn more about these tools, or if you would like to contribute ideas to develop for this blog, please e-mail us at:
ironman at politicalcalculations
Thanks in advance!
Closing values for previous trading day.
This site is primarily powered by:
CSS Validation
RSS Site Feed
JavaScript
The tools on this site are built using JavaScript. If you would like to learn more, one of the best free resources on the web is available at W3Schools.com.

