
When we launched the S&P 500's Thanksgiving Leftover project the day after Thanksgiving 2025, we knew we were going to spend the next year following the stock prices of companies that weren't doing very well. After all, to even make the list, the ten companies whose stocks we would track ranked as the S&P 500's worst performing stocks of 2025.
In the nine months since then, a few of those stocks have outperformed the index, while the rest have lagged behind. Most of those stocks have fallen below their post-2025 Thanksgiving Day level, but not by anywhere near as much as they had fallen to qualify as one of the S&P 500's worst performing stocks in 2025.
But one stock in particular has gone on to plumb new depths. It has continued to fall so much more that it is on track to qualify as one of the S&P 500's worst performing stocks of 2026.
That stock is The Trade Desk (NASDAQ: TTD), the digital advertising firm analyst David Desjardins believes is facing an "existential crisis". Here's how he describes the company's now nearly two year long fall from grace:
After reporting highly disappointing financial results for the second quarter of 2026, shares of The Trade Desk, Inc. (TTD) declined by a whopping 21.9% last Friday, which came on top of a 6.8% decline on the prior day. Since the publication of my initiating coverage in early February 2026, TTD's stock price has basically been cut in half, from ~$27.00 per share at the time of publication to around $13.39 as of today's market close.
Relative to its all-time high of $141.53 reached in December 2024, The Trade Desk has now declined by a massive ~90%. As David Einhorn famously said, a stock down 90% is just a stock that was down 80% before being cut in half again, and this is exactly what happened to TTD since last February. The depth of TTD's sell-off is quite something, but what is even more impressive to me is its speed....
At this point, The Trade Desk has become one of the most hated stocks that I am aware of, and this is on top of being the worst-performing constituent in the S&P 500 (SPX) on a year-to-date basis. Pretty much everything said or written about the company is negative, and it is precisely why I decided to write an update today. In less than two years, TTD went from a market darling that could do no wrong at over 26.0x forward sales to being viewed as a melting ice cube changing hands at 2.3x forward sales today.
The following chart compares The Trade Desk's stock performance with the S&P 500, from 29 November 2024 (aka "the day after Thanksgiving Day 2024) through 18 August 2026:

Believe it or not, despite the company's continued misfortune, Desjardins views the company's low stock price as a speculative strong buy opportunity, where he makes the argument that the company has some potential for a turnaround based on its available cash balance, lack of debt, and cash flow.
We disagree, because we think The Trade Desk has further to fall before it might reach that point.
Here's why. According to SlickCharts, The Trade Desk's market cap has fallen to where the company now ranks 502 out of the 503 stocks that make up the S&P 500 index. Because it has, and because its fall is continuing, the company's stock is verging on the point where S&P will act to remove it from the index. If and when that happens, as increasingly seems likely, its stock price will experience the opposite of what happens when a company's stock is included in the index, which is to say its stock price will fall even further.
A deeper decline is almost ensured given the negative outlook CEO Jeffrey Green communicated during the company's 2026-Q2 earnings call. Gytis Zizys, who formerly held a buy rating for the company on the hope it will see a turnaround, reacted to that development:
The Trade Desk, Inc. (TTD) provided one of the worst guidances I’ve seen in recent months, which put the last nail in the coffin for many shareholders who were still clinging to the idea of a turnaround. It seems I was prematurely too bullish on the turnaround as well, and this report is forcing me to downgrade it to a hold. I don’t think there’s a point in selling at these low prices, unless you want to harvest some tax losses. If it gets to under $10 per share, I will be jumping in to see what happens over the next couple of years. It’ll either recover, or my investment will go to zero.
The only problem with this investing strategy is we can argue that the bar for being able to beat TTD's stock performance is very low. It's so low that investing almost anywhere else or just parking the money in a cash savings account would be more advantageous.
This article is a standalone feature in our ongoing Thanksgiving Leftover series, which will continue with its regular monthly installment later this month. The ongoing tragedy of the performance of The Trade Desk's stock demanded a special edition.
Labels: ideas, SP 500, stock prices, thanksgiving


April 2026 saw positive changes for the ten worst performing stocks the S&P 500 (Index: INX) served up for Thanksgiving 2025.
Since 28 November 2025, the 503 stocks that make up the market-capitalization weighted S&P 500 index have collectively risen to 104.2% of their value on the day after Thanksgiving Day in 2025.
But when similarly weighted by their market caps into their own index, the ten worst performing stocks of the S&P 500 in 2025, a.k.a. the Thanksgiving Leftover stocks, have collectively fallen to 95.5% of their value on the day after Thanksgiving 2025. Still, that's quite an improvement over where there were almost a month ago when they bottomed at 90.3% of their post-Thanksgiving Day level, even though it would have been outperformed by the entire S&P 500 index.
It could even be much worse. Over the same five month interval, an equal-weighted index of the same ten Thanksgiving Leftover stocks have fallen to be worth just 89.1% of their recorded value at the close of trading on 29 April 2026. Together, they had plunged as low as 80.5% of their day after Thanksgiving Day level on 27 March 2026 before proceeding to stage a recovery through April 2026.
The following chart shows how each of these groupings of stocks, the S&P 500 index and the ten Thanksgiving Leftover stocks, both market cap-weighted and equal-weighted, have fared since 28 November 2025.

As a group, the Thanksgiving Leftover stocks are clearly still losers with respect to the whole S&P 500 index. But individually, three of these ten stocks have outperformed the entire index in the five months since 28 November 2025.
The next chart tracks how each of the ten Thanksgiving Leftover stocks have performed over this period, showing their value on 29 April 2026 as a percentage of their value on 28 November 2025:

In previous editions of this series, we've focused on the worst of 2025's ten worst S&P 500 stocks. But the gains of three stocks are clearly putting the whole index' performance to shame.
Dow Inc. (NYSE: DOW) has done the best of the bunch through 29 April 2026, increasing to 165.8% of its value on 28 November 2025. The chemical company's stock has benefited from the restructuring of its business to focus on growth opportunities, which led its stock to rise from $23.85 on 28 November 2025 to $32.65 on 13 February 2026. Since then however, the company has seen its forecast earnings soar along with other publicly-traded chemical companies as a result of the Iran war because the geopolitical event has disrupted the operations of their largest international competitors in the Middle East.
The second-best performing Thanksgiving Leftover stock is Molina Healthcare (NYSE: MOH). The health insurer has seen quite a lot of volatility in 2026, but in the last few weeks, its stock has sharply risen because it beat its earnings expectations for the first quarter of 2026 by a wide margin. Molina Healthcare accomplished this result by focusing on controlling its costs, while the company has benefited from the escalation of Medicare reimbursement rates that were announced earlier in the month.
The third Leftover stock doing better than the S&P 500 is Deckers Outdoor (NYSE: DECK). On 29 April 2026, the shoe company's stock was 115.1% of its 28 November 2025 level. Deckers Outdoor has fallen since peaking after it announced strong earnings near the end of January 2026, but still remains above the S&P 500's level.
In any case, we now have an answer to the question we raised at the end of our previous edition of this series: If you were going to place a bet on the outcome, would you take the over or the under for the Thanksgiving Leftover Stocks given where they were at a month ago? Readers who took the over would be winners.
But what about now? If you were offered a new chance to place a bet for where the Thanksgiving Leftover stocks will be at the end of May 2026, compared to their level at the close of trading on 29 April 2026, would you take the over or the under?
Not that it's much help, but there's a reason why so many commercials for trading firms carry the disclaimer: "Past performance is not indicative of future results". With that in mind, if you won the last time around, would you go for double or nothing?
Labels: SP 500, stock prices, thanksgiving
Admittedly, we've only been following the ten worst performing component stocks of the S&P 500 (Index: INX) in 2025 for the last four months, but we're starting to think that many, if not most, of these stocks would not have made very good investments during that time.
If you're just joining this series, the Thanksgiving Leftover Stocks are a group of ten stocks that Seeking Alpha's Jason Capul identified as "Thanksgiving leftovers no one wants". Four month later, that's mostly true, but with one notable exception.
That exception is Dow Inc. (NYSE: DOW). Back on 28 November 2025, the chemical industry giant was trading at $23.85 per share. Four months later, through the close of trading on 25 March 2026, the company's share price has risen to $39.63. Or rather, its value has increased to be 166% of what it was on the day after Thanksgiving 2025, as the company's outlook has brightened in response to the geopolitical turmoil disrupts the supply chains of its foreign competition.
The following spaghetti chart presents the performance of each of the ten Thanksgiving Leftover Stocks with respect to the S&P 500, each indexed with respect to their closing values on 28 November 2025.

Aside from Dow, the only other company whose stock has registered a sustained increase is Deckers Outdoor (NYSE: DECK). The footwear designer behind popular sneaker and boot brands like Hoka, Teva, and UGG has seen its stock grow to $100 per share at the close of trading on 25 March 2026, 122% of its post-Thanksgiving Day 2025 level.
The remaining eight Thanksgiving Leftover stocks are doing less well than the S&P 500, which itself is just 96.2% of its day-after-Thanksgiving-Day value. Five of these eight firms are bunched within ten percent of the S&P 500's level, but the remaining three are doing much, much worse. Here's a quick summary of their share prices on 25 March 2026:
- Factset Research Systems (NYSE: FDS) - Share Price: $193.78 (69.9% of 28 November 2025 value)
- Gartner (NYSE: IT) - Share Price: $150.23 (64.5% of 28 November 2025 value)
- Trade Desk (NASDAQ: TTD) - Share Price: $21.97 (55.5% of 28 November 2025 value)
We covered The Trade Desk's decline in the previous edition, but observe the ad-tech firm's ongoing implosion has recently gotten worse as an audit firm advised its clients to avoid it. Through this point of 2026, The Trade Desk is the worst performing component stock of the entire S&P 500 index.
The other two poor performers, Gartner and FactSet, aren't far behind. Gartner, an IT research firm and consulting house whose business model is directly in the crosshairs of AI technology, which promises to do much of the same things that Gartner does at much lower costs. Financial data provider FactSet faces a very similar existential challenge from AI technologies, which the trend for its stock price is capturing.
As for how 2025's Thanksgiving Leftover Stocks are doing as a group, we find they are underperforming the S&P 500. If we treat them like an equal-weighted index, they're doing horribly, but if we weight them by their market capitalization, like the S&P 500 itself, they're still doing worse, but not anywhere near as badly. The following chart visualizes how they've done during the last four months:

Perhaps all this will change in the next month when we next update how 2025's Thanksgiving Leftover stocks are doing in 2026. Or not. If you were going to place a bet on the outcome, would you take the over or the under?
Labels: investing, SP 500, thanksgiving
Here we are, three months after Thanksgiving 2025. How are the Thanksgiving Leftover Stocks of the S&P 500 (Index: SPX) doing?
The Thanksgiving Leftover Stocks are a group of ten stocks that Seeking Alpha's Jason Capul identified as "Thanksgiving leftovers no one wants". Going into Thanksgiving 2025, these were the worst performing stocks of the index, having lost anywhere from 41.7% to 70.1% of their value up to that point of the year.
We've been tracking the daily ups and downs of these stocks since Thanksgiving 2025, creating two hypothetical stock indices to track them. One is a simple equal-weighted index, consisting of an equal number of shares of each stock. The other is a market capitalization-weighted index, like the S&P 500 itself, which we introduced in the previous edition of this series. We're comparing the performance of both of our Thanksgiving Leftover indices with that of the S&P 500.
The following chart shows where each of these indices stand after one quarter.

There have been dramatic changes since the previous edition. One month ago, both Thanksgiving Leftover Stock indices were handily beating the S&P 500. But now, through the end of trading on 25 February 2026, we find the S&P 500 is outperforming both having reached a value 101.4% of its value on the day after Thanksgiving 2025.
The value of the market cap-weighted version of the Thanksgiving Leftover Stocks has dropped to be 97.7% of its post-Thanksgiving Day value, but the equal-weighted version has lost 11.5% of its value, clocking in at 88.5% of its value on 28 November 2025.
The following spaghetti chart reveals the performance of each of the ten Thanksgiving Leftover Stocks with respect to the S&P 500, each indexed with respect to their closing values on 28 November 2025.

Three of the ten Thanksgiving Leftover stocks have beaten the S&P 500 in the last quarter: Deckers Outdoor (NYSE: DECK), Dow Inc. (NYSE: DOW), and Chipotle Mexican Grill (NYSE: CMG), which have risen to be 135.7%, 125.8%, and 108.6% of their values recorded on 28 November 2025.
Another three, Alexandria Real Estate Equities (NYSE: ARE), Fiserv (NASDAQ: FISV), and Molina Healthcare (NYSE: MOH) are treading water, coming within a few percent but still below the performance of the S&P 500.
The final four Thanksgiving Leftover Stocks however are still being clobbered by bears. Of these, Lululemon Athletica (NASDAQ: LULU) has done the best, dropping to 81.1% of its Thanksgiving Leftover Day value. Gartner (NYSE: IT) and Factset Research Systems (NYSE: FDS) are worth 78.4% and 74.5% what they were on 28 November 2025. But The Trade Desk (NASDAQ: TTD) is by far the worst, having dropped to 63.6% of its Day-After-Turkey-Day price.
Which is really amazing when you consider that to even be on this list, it had already registered the second worst performance of the individual stock components that make up the S&P 500 index. Since the beginning of trading on 2 January 2025, The Trade Desk's share price has fallen 78.8% in value, dropping from $117.73 to $24.94 per share on 25 February 2026.
That's a performance that raises questions of whether TTD will remain within the S&P 500 index. Seeking Alpha reports The Trade Desk's market capitalization is $12.06 billion, but that was before the firm reported better than expected earnings but a disappointing outlook after the closing bell on 25 February 2026.
That's less than the $13.36 billion market cap reported by Seeking Alpha for the Class B shares of News Corp (NWS), which was the smallest company by market cap in the S&P 500. If its bad fortune persists, Standard and Poor's next adjustment to its flagship index could see the Thanksgiving Leftover Stocks of the S&P 500 drop from ten to nine members this year.
Labels: ideas, SP 500, stock market, thanksgiving

Would the Dogs of the Dow investing strategy work for the year's worst performing component stocks of the S&P 500 (Index: SPX)?
We're asking that question because Seeking Alpha's Jason Capul posted an article with the irresistibly clickbait title of "Thanksgiving leftovers no one wants: 10 worst S&P 500 stocks of 2025" just before the Thanksgiving holiday for the U.S. stock market. Now that it's the day after the Thanksgiving holiday, we're wondering if the S&P 500's 'thanksgiving leftovers', the ten stocks that have lost the most value during the year-to-date in 2025, might provide an opportunity to deliver better returns than the S&P 500 itself in the next year.
Which would be cool if it works, but we don't know that it does. Here's how Investopedia describes how the Dogs of the Dow investing strategy works:
The general concept is to allocate money to the 10 highest dividend-yielding, blue-chip stocks among the 30 components of the DJIA. This strategy requires rebalancing at the beginning of each calendar year.
That presents a problem for the 10 worst-performing stocks of the S&P 500, because none of these stocks would be considered blue chip companies and because seven of the ten pay no dividends. Here's the list with stock prices and Year-To-Date (YTD) stock price performance as of 28 November 2025 to make them genuine Thanksgiving leftovers!
- Fiserv (NASDAQ: FISV) - $61.47 (YTD: -70.1%)
- Trade Desk (NASDAQ: TTD) - $39.56 (YTD: -66.3%)
- Deckers Outdoor (NYSE: DECK) - $88.03 (YTD: -56.7%)
- Gartner (NYSE: IT) - $232.74 (YTD: -52.0%)
- Lululemon Athletica (NASDAQ: LULU) - $184.18 (YTD: -51.8%)
- Molina Healthcare (NYSE: MOH) - $148.26 (YTD: -49.1%)
- Alexandria Real Estate Equities (NYSE: ARE) - $53.67 (YTD: -45.0%)
- Chipotle Mexican Grill (NYSE: CMG) - $34.52 (YTD: -42.8%)
- Factset Research Systems (NYSE: FDS) - $277.27 (YTD: -42.3%)
- Dow Inc. (NYSE: DOW) - $23.85 (YTD: -40.6%)
The three firms that pay dividends on this list are Alexandria Real Estate Equities (a real estate investment trust that focuses on pharmaceutical and biotech facilities), Factset Research Systems (a provider of financial data and analysis for financial professionals), and Dow Inc. (a manufacturer of chemicals, with no relation to Dow Jones Industrial Average that puts the "Dow" into the "Dogs of the Dow" investing strategy).
For our Thanksgiving leftovers from the S&P 500, we're going to look two hypothetical investing scenarios. For the first, we'll invest in only the "high-yielding" members of the list of Thanksgiving leftover stocks and compare how that investment performs against the seven other stocks in the list and the S&P 500 as a whole.
For the second hypothetical scenario, we'll invest in the entire list of stocks with the size of the investments weighted by their share of the ten stocks' market capitalizations as of 28 November 2025, and see how that compares against the S&P 500.
We have no idea how any of that is going to turn out. Will reversion to the mean happen for these worst performers giving each a market-beating rate of return? Or will the troubles at the companies that caused their stock prices to plummet so much in the first place keep them falling through the floor? Will the dividend-paying firms or non-dividend paying firms deliver a better performance? Or will the S&P 500 reign supreme over all of the above?
We're excited to find out! We'll nail down the methodology and update the status of how the Thankgiving Leftover stocks are doing about once a month, with the first update coming sometime in January 2026.
Image credit: Turkey sandwich photo by Matthew Moloney on Unsplash.
Labels: ideas, investing, thanksgiving
Thanksgiving has a defining theme in 2025. The population of turkeys raised on U.S. farms shrank from the previous year. The size of those live turkeys also shrank. Completing the trifecta, the Farm Bureau Federation confirms the price of a Thanksgiving dinner has shrunk as well, led lower by a big drop in the price of turkeys!
That cost had peaked at $64.05 for a 10-item menu in 2022 thanks to the runaway inflation unleashed by the Biden-Harris administration. Since then, the cost has dropped each year, falling to $61.17 in 2023 and to $58.08 in 2024. This year, that cost dropped 2.9% to $55.18.
The Farm Bureau describes how a drop in the price of turkeys contributed to 2025's lower Thanksgiving dinner cost:
The centerpiece on most Thanksgiving tables – the turkey – dramatically decreased in price, which helped bring down the overall cost of dinner. The average price for a 16-pound frozen turkey is $21.50. That is $1.34 per pound, down more than 16% from last year. While the wholesale price for fresh turkey is up from 2024, grocery stores are featuring Thanksgiving deals and attempting to draw consumer demand back to turkey, leading to lower retail prices for a holiday bird....
“It’s encouraging to see some relief in the price of turkeys, as it is typically the most expensive part of the meal,” said AFBF Economist Faith Parum, Ph.D. “Farmers are still working to rebuild turkey flocks that were devastated by avian influenza, but overall demand has also fallen. The combination will help ensure turkey will remain an affordable option for families celebrating Thanksgiving.”
Here's the Farm Bureau's infographic indicating each of the menu items for their Thanksgiving dinner and the average prices they found them when they shopped for them during the first week of November 2025:

Although turkeys are much less costly for American consumers, they found both increases and decreases in the prices of several items compared to last year.
Half of the ingredients in the survey declined in price, including dinner rolls and stuffing. Low wheat prices helped bring down the cost of items requiring flour.
Items like fresh vegetables and sweet potatoes increased – a veggie tray is up more than 61% and sweet potatoes are up 37%. Natural disasters partly contributed to the increase. For example, North Carolina, which is the largest grower of the nation’s sweet potatoes, suffered hurricane damage. Additionally, fresh produce prices tend to be highly volatile, and even modest supply-chain disruptions, from weather, labor shortages, transportation delays or regional production setbacks, can trigger sharp, short-term spikes in prices. The continued shortage of farmworkers and rapidly increasing farm wages also played a role in rising produce costs. It’s important to note that fresh vegetables and potatoes are traditionally low-cost items, so an increase of just a few cents can dramatically affect the cost change percentage year-to-year.
Here are the average prices of the Farm Bureau's Thanksgiving dinner menu items with their percentage and dollar changes in cost from 2024 to 2025:
- 16-pound turkey: $21.50 or $1.34 per pound (down 16.3%, or -$4.17 for the whole turkey)
- 14-ounces of cubed stuffing mix: $3.71 (down 9%, or -$0.37)
- 2 frozen pie crusts: $3.37 (down .8%, or -$0.03)
- Half pint of whipping cream: $1.87 (up 3.2%, or +$0.06)
- 1 pound of frozen peas: $2.03 (up 17.2%, or +$0.30)
- 1 dozen dinner rolls: $3.56 (down 14.6%, or -$0.60)
- Misc. ingredients to prepare the meal: $3.61 (down 4.7%, or -$0.14)
- 30-ounce can of pumpkin pie mix: $4.16 (up .1%, or +$0.01)
- 1 gallon of whole milk: $3.73 (up 16.3%, or +$0.52)
- 3 pounds of sweet potatoes: $4.00 (up 37%, or +$1.07)
- 1-pound veggie tray (carrots & celery): $1.36 (up 61.3%, or +$0.52)
- 12-ounce bag of fresh cranberries: $2.28 (down 2.8%, or -$0.07)
Overall, the $55.18 cost of a Thanksgiving dinner in 2025 is $8.87 or about 14% lower than in 2022.
References
Farm Bureau Federation. Cost of Thanksgiving Dinner Declines. [Online article]. 19 November 2025.
Farm Bureau Federation. Cost of Thanksgiving Dinner Declines – Remains Higher Than Pre-Pandemic Levels. [Online article]. 20 November 2024.
Labels: food, thanksgiving

2025 saw the population of U.S. farm-raised turkeys decline. But that's not the only thing about turkeys that shrank during the past year. The average live weight of turkeys has also fallen.
The U.S. Department of Agriculture's initial estimate of the live weight of the turkeys that were raised during 2025 is 32.0 pounds, which is down from 32.8 points in 2024 and is coincidentally back to what the average farm-raised turkey weighed in 2023.
First, let's see how the live weight of farm-raised turkeys in 2025 compares with the averages recorded in previous years. The following interactive chart shows how the size of live turkeys raised on U.S. farms has changed from 1970 through 2025.
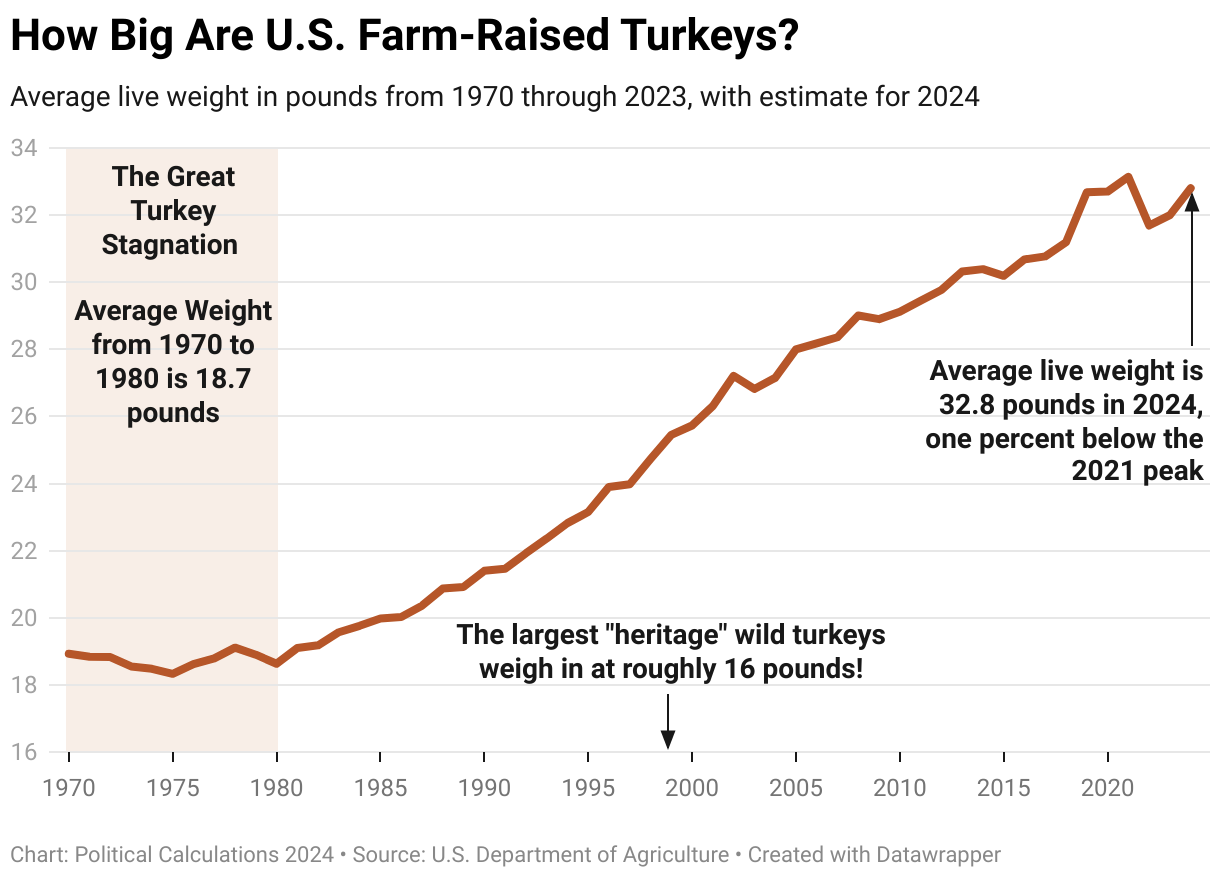
Even at 32 pounds, farm-raised turkeys in 2025 are double the average size of wild "heritage" turkeys in the U.S. Virtually all of the increase in the size of farm-raised turkeys has taken place since 1980. Since 2020, the growth of U.S. farm-raised turkeys has stagnated largely because of two factors.
The first is the inflation unleashed by the Biden administration that sent feed prices soaring, making it much more costly for turkey farmers to raise turkeys. The second is bird influenza, in which the culling of turkey flocks to limit its spread has reduced the available supply, leading turkey producers to process smaller birds for market than they ordinarily would to meet consumer demand.
What that all means is that the growth of the average farm-raised turkey has stagnated since 2021, making the period since like the great stagnation of the 1970s. Coincidentally, that era was also defined by high inflation in the U.S. economy.
References
U.S. Department of Agriculture. Turkeys Raised. [PDF Document]. 26 September 2025.
U.S. Department of Agriculture. World Agricultural Supply and Demand Estimates (WASDE). U.S. Quarterly Animal Product Production. Nov Proj. Turkey (Ready To Cook Weight, millions of pounds). [PDF Document]. 14 November 2025.
U.S. Department of Agriculture. Meat statistics tables, recent. Table 3 - Livestock and poultry live and dressed weights. [Excel Spreadsheet]. 30 September 2025.
Image credit: Close-up of a turkey's head and neck photo by Chandler Cruttenden on Unsplash.
Labels: thanksgiving

The population of farm-raised turkeys fell in 2025, continuing a decades-long trend of shrinking.
The U.S. Department of Agriculture's National Agricultural Statistics Service reported an initial population estimate of 194.5 million, which represents the total production of turkeys on U.S. farms for 2025. The NASS also revised its 2024 population estimate downward, from 205 million to 200 million.
The decline in the population of turkeys has been ongoing since the population of farm-raised turkey's in the U.S. peaked at 302.7 million in 1996. 2025's estimated population of 194.5 million farm-raised turkeys was last previously observed between 1985 and 1986, when the production of turkeys surged from 185.4 to 207.2 million because of increased demand for lean protein during the low-fat diet craze of that era.
The Epoch Times describes the rise and fall of turkey in America and what that says about how much turkey Americans are eating:
Turkey consumption in the United States has followed an arc over the past century, driven by agricultural, technological and health trends.
According to the USDA Economic Research Service, the average person in the United States ate less than three pounds of turkey a year in the 1930s and 1940s. By 1960, that number had doubled, as producers introduced specialized bird breeds that yielded more meat.
Advances in production and the introduction of processed products such as luncheon meats, ground turkey, and deli items drove turkey’s popularity in the 1980s. Marketing campaigns promoted the bird as a healthy, low-fat meat.
Annual turkey consumption rose from an average of about 10 pounds per person in 1980, to a peak of 18 pounds per person in 1996.
Since that time, however, consumers have been steadily eating less turkey. In 2025, average turkey consumption is projected to be just over 13 pounds per person, a nearly 40 year low.
In total, the USDA projects 4.5 billion pounds of turkey will be eaten in 2025—the lowest amount since 1990, according to the latest World Agricultural Supply and Demand Estimates (WASDE) report.
The USDA estimates 195 million turkeys were raised in 2025, the lowest number in 40 years. This is the second consecutive annual decline, with production falling about 3 percent from 2024 and around 11 percent from 2023.
The following interactive chart presents the number of farm-raised turkeys for each year from 1970 through 2025:
Americans will eat about 30 million of those 194.5 million farm-raised turkeys during the 2025 Thanksgiving holiday.
On a final note, our interactive chart doesn't account for the population of wild turkeys in the United States. The U.S. Fish and Wildlife Service indicates that portion of the total population of turkeys in the U.S. was around 6.5 million in 2024. Without anything to suggest any major changes in the wild population has occurred, we assume this estimate is still valid. Including the wild population of turkeys with farm-raised turkeys brings the total estimated population of the bird up to 201 million for 2025.
References
U.S. Department of Agriculture National Agricultural Statistics Service. Livestock Historic Data. [Online Database: Survey - Animals & Products - Poultry - Turkeys - Production - Turkeys Production Measured in Head - Total - National - US Total - 1929-2025 - Annual - Year]. Accessed 23 November 2025.
Image credit: A group of turkeys in a fenced area photo by Heather Gill on Unsplash.
Labels: thanksgiving

The day after Thanksgiving is a difficult one because you now have to figure out what to do with all those leftovers from the big meal. Not all of them will be as good on their second serving. The turkey will be drier. Any vegetables or potatoes you cooked will be at risk of being overcooked when you heat them up again. Dishes that involve words like "casserole" are almost certainly best disposed of because they were bad ideas to begin with.
There is one exception. There's always room for pie.
Smart planning for Thanksgiving means preparing more than one pie to ensure that you can have enough pie to survive to the day after. While pumpkin pie is the traditional pie for Thanksgiving dinner, having another kind of pie on hand is the bonus you deserve for having enough restraint on Thanksgiving to ensure you can have more pie.
What other kind of pie do you want to have?
Sabrina Elfarra curated data from Google Trends in 2023 to find out what other kinds of pies Americans were looking up recipes to cook in the days leading up to Thanksgiving that year. Here's her map illustrating what she found to be the most popular Thanksgiving pie recipe search by state:

The alternate (non-pumpkin) pie recipes include:
- Apple
- Blackberry
- Cherry
- Coconut
- Grape
- Banana Cream
- Banoffee
- Buttermilk
- Butterscotch
- Cream
- Key Lime
- Chocolate
- Mississippi Mud
- Peanut Butter
- Pecan
- Frito Chili
- Sweet Potato
- Tamale
- Shoofly
If you're looking for non-pumpkin pie options, you might consider these for their second pie potential at next year's Thanksgiving holiday. Choose wisely!
Image credit: Different types of pies on a dining table by grabadonut on Wikimedia Commons. Creative Commons Creative Commons 4 - CC BY-SA 4.0.
Labels: data visualization, food, thanksgiving

Today is the big event! And if you're not already starting to cook that turkey for your 2024 Thanksgiving feast, you soon will be!
But before you get started, let's address a question that may already be in the back of your mind from when you picked up the bird you'll be cooking. Is this year's turkey bigger than the one you cooked last year?
There's a good chance it is. The U.S. Department of Agriculture's initial estimate of the live weight of the turkeys that were raised during 2024 is 32.8 pounds (14.9 kilograms). That's up 2.5% from their 2023 estimate of 32 pounds.
But it's not as big as 2021's record live weight of 33.1 pounds (15.0 kilograms). The following interactive chart shows how the size of live turkeys raised on U.S. farms has changed over the 55 years from 1970 through 2024.
At more than 32 pounds, farm-raised turkeys are more than double the size of wild "heritage" turkeys in the U.S. on average. Most the increase in the size of farm-raised turkeys has taken place since 1980.
References
U.S. Department of Agriculture. Turkeys Raised. [PDF Document]. 27 September 2024.
Image Credit: Microsoft Copilot Designer. Prompt: "A picture of a turkey who has been exercising and building up bulk".
Labels: data visualization, thanksgiving, turkey

Farm-raised turkeys account for about 97% of the entire population of turkeys in the United States. If you are having turkey at your 2024 Thanksgiving dinner, it almost certainly came from a farm.
Of the 205 million turkeys raised on U.S. farms during 2024, 180 million were raised in just 13 states. Which state do you suppose your Thanksgiving turkey came from?
Until "Big Turkey" starts putting that information on their packaging labels, you're simply going to have to play the odds. To make that easier, we've generated the following interactive map which identifies the top turkey-producing states of the U.S. and indicates the number of turkeys raised on farms within them.
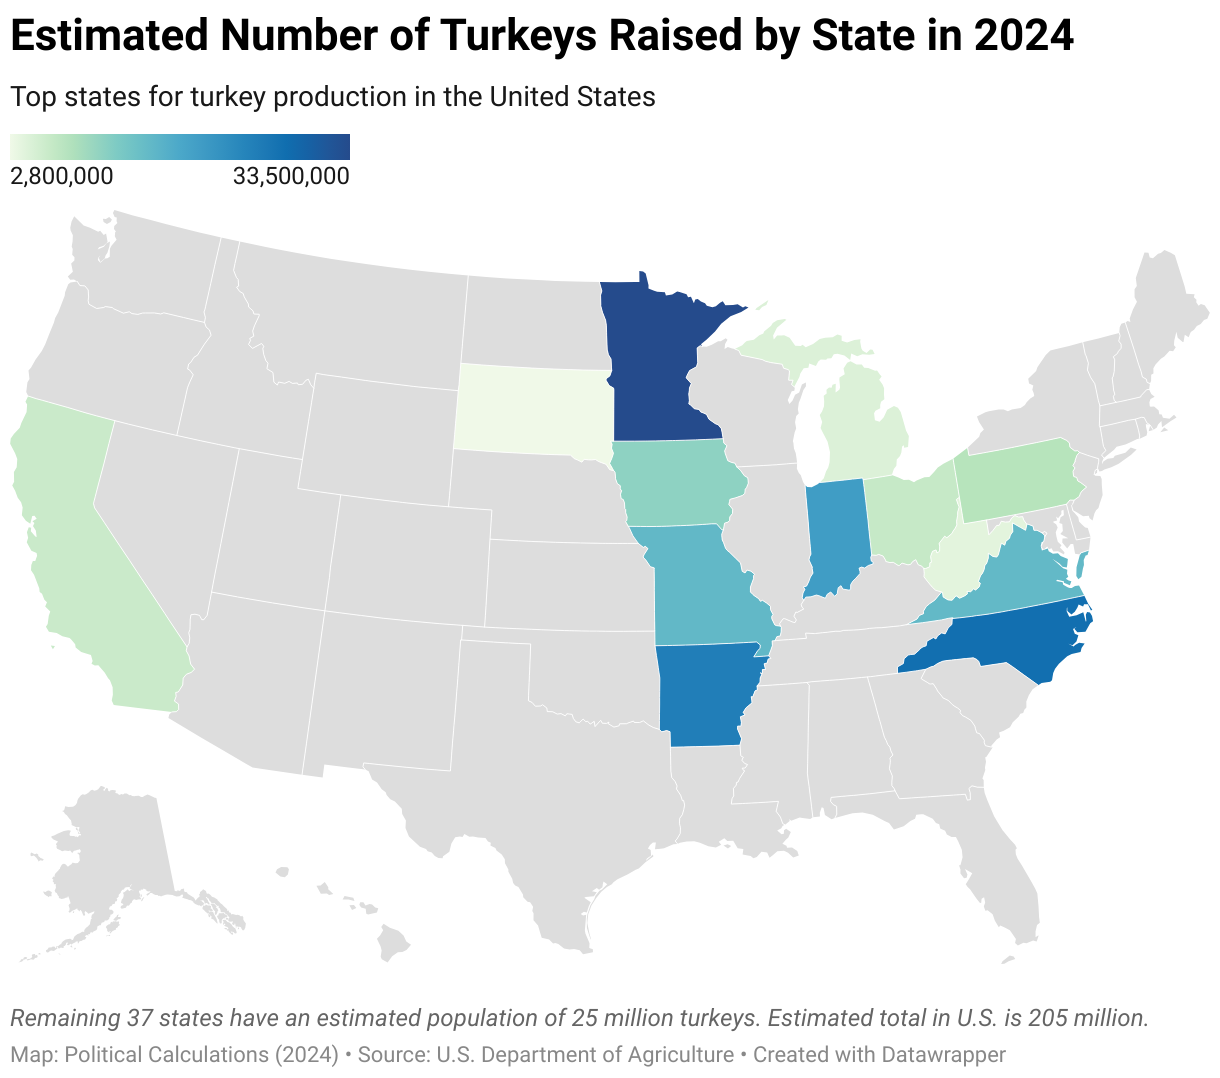
When you play the odds, you'll find there is a one-in-six probability that the turkey on your table will have come from 2024's top producer of farm-raised turkeys: Minnesota.
If you want to get odds that are more in your favor, there's a better than 50% chance your turkey will have come from one of four states: Minnesota, North Carolina, Arkansas, or Indiana. Meanwhile, the odds are a little better than one-in-three that it came from either California, Iowa, Michigan, Missouri, Ohio, Pennsylvania, South Dakota, Virginia, or West Virginia. Not to mention a one-in-eight probability it came from a turkey farm in any of the other 37 states.
References
U.S. Department of Agriculture. World Agricultural Supply and Demand Estimates (WASDE - 654). U.S. Quarterly Animal Product Production. Nov Proj. Turkey (Ready To Cook Weight, millions of pounds). [PDF Document]. 8 November 2024.
Image Credit: Microsoft Copilot Designer. Prompt: "A picture of a turkey looking at a map of the United States".
Labels: data visualization, thanksgiving, turkey

It's Thanksgiving week! We're marking the occasion by taking on questions that may come up during family celebrations of the holiday. And while many of these questions might be asked by children, they're important enough that the U.S. Department of Agriculture's National Agricultural Statistics Service and the U.S. Fish and Wildlife Service keeps track of them.
Let's start with a very basic question: How many turkeys are there in the United States?
The answer to that question comes in two parts, because there are two distinct portions of the population of turkeys in the U.S. There are farm-raised turkeys, which are mainly raised in 13 states, and there are wild turkeys, who live throughout most of the continental U.S.
We'll start with the population of farm-raised turkeys, because their numbers are so much larger than the population of wild turkeys. In 2024, an estimates 205 million turkeys have been raised on U.S. farms. That number is down from 2023's estimated 219 million farm-raised turkeys and is well below the record number of 302.7 million turkeys that were raised on U.S. farms in 1996.
The following interactive chart presents the number of farm-raised turkeys for each year from 1970 through 2024:
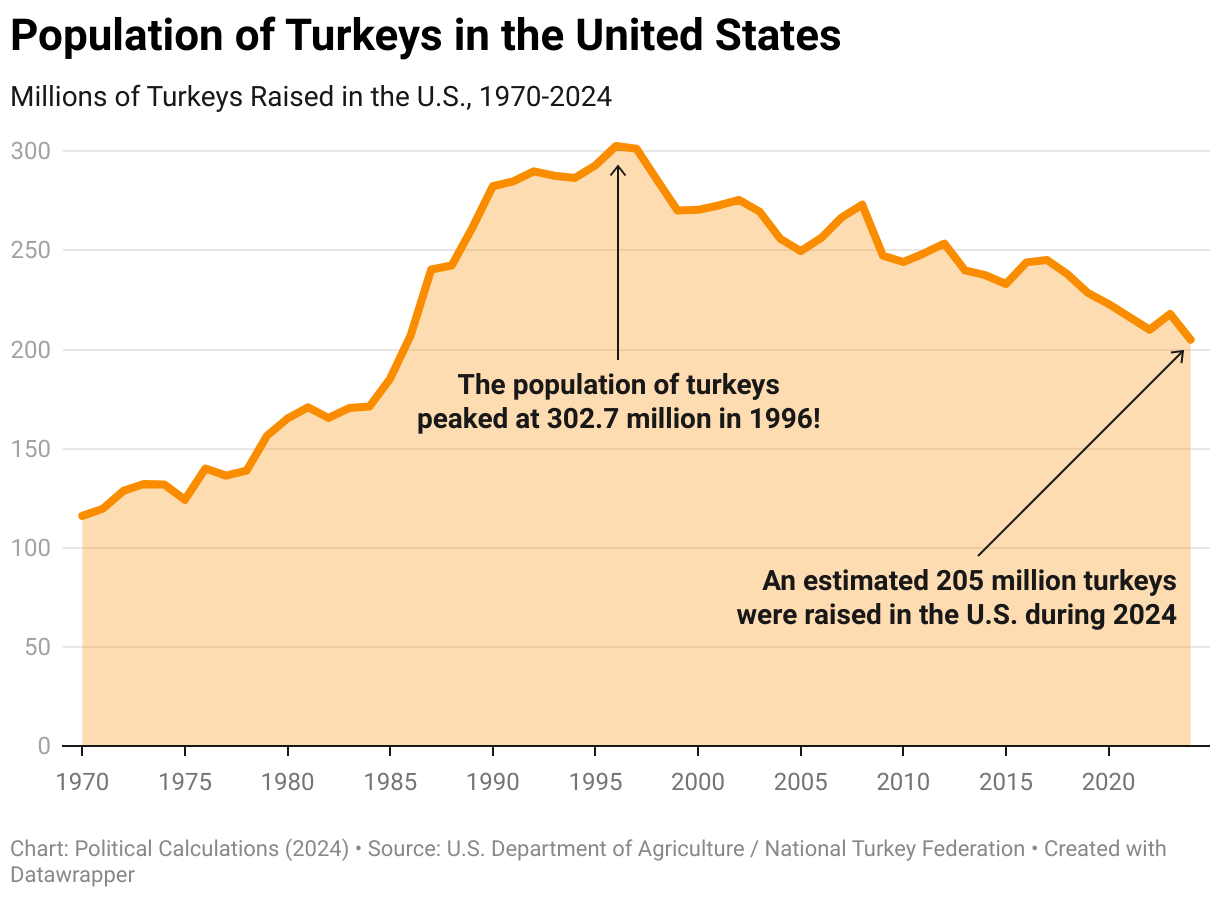
It's harder to count the population of wild turkeys in the U.S. because their numbers have to be inferred from data collected by hunters and conservationists, where for every wild turkey they see, there are many more they did not see. The U.S. Fish and Wildlife Service reports there are an estimated 6.5 million wild turkeys in the U.S.
That puts the total population of turkeys in the U.S. at 211.5 million in 2024. Since about 97% of these turkeys were raised on farms, those birds are the ones you'll most often find at the center of a traditional Thanksgiving dinner.
References
U.S. Department of Agriculture National Agricultural Statistics Service. Livestock Historic Data. [Online Database: Survey - Animals & Products - Poultry - Turkeys - Production - Turkeys Production Measured in Head - Total - National - US Total - 1929-2024 - Annual - Year]. Accessed 14 November 2024.
Susan Morse. U.S. Fish and Wildlife Service. Wild Facts About Turkeys. [Online article]. Accessed 24 November 2024.
Image credit: Turkeys being raised on a turkey farm by Scott Bauer for the U.S. Department of Agriculture (3 February 2013) on Flickr. Creative Commons CC by-SA 2.0 Attribution-Sharealike 2.0 Generic Deed.
Labels: food, thanksgiving, turkey
Louis Weisz achieved internet immortality in 2021 when he cooked a chicken by slapping it. Or more accurately, building a slapping machine that converted kinetic energy into enough heat to cook a chicken from repeatedly striking it.
But would that technology work to cook a turkey? In the following less than 22-minute video, he finds out not only if he can but whether the final result is worthy of being eaten as part of a Thanksgiving dinner!
The consensus among his guests? It's tastes like turkey!
Being traditionalists, we'll stick with more familiar turkey cooking methods, but if you go for the slapping method, the IIE team wishes you a Happy Slapsgiving!
From the Inventions in Everything Archives
Here's a sampling of other inventions involving turkeys, unique kitchen gadgets, and devices capable of delivering a slap!
- Solving Crimes with Turkey DNA Evidence
- Invention in Everything: The Truly Boneless Thanksgiving Turkey
- Inventions in Everything: A Pat on the Back
- Inventions in Everything: A Five-in-One Kitchen Multitasker
- Inventions in Everything: Ice Cream Pint Lock
- Inventions in Everything: The Flask from the Future
- Inventions in Everything: Stopping the Refrig-a-raider
- Inventions in Everything: Suction Tube for Reverse Axial Withdrawal
- The Kitchen Unitaskers You Cannot Live Without
- Inventions in Everything: Geothermal Beer Coolers
- Inventions in Everything: The Ultimate Turkey Blind
Labels: technology, thanksgiving
The American Farm Bureau Federation reports the cost of providing a traditional Thanksgiving turkey dinner for 10 people in 2023 is 4.5% lower than it was in 2022. The identical grocery items that cost $64.05 a year ago now cost $61.17 according to the Farm Bureau's annual shopping survey.
But as you'll see in the following chart, the cost of that traditional Thanksgiving dinner is still well elevated above what it was in 2020.

There's a lot of information in the chart showing how prices for the ten items of the AFBF's Thanksgiving dinner shopping list has changed in each year since 2020. We've used clustered columns along its horizontal axis to indicate the annual average price paid for each of the individual items, which are ranked according to their 2021 cost. We've also presented a cumulative cost curve for each year to show how each item adds to the total meal cost that is arrived at on the right-hand side of the chart.
Presenting the data this way lets us see that the increase in the cost of turkey is once again responsible for most of the year-over-year change in the cost of the meal. Here we see the cost of a 16-pound bird declined by 5.6% to $27.35 in 2023. That decline is attributable to the rebound from the negative impact of 2022's avian influenza epidemic on the supply on turkeys during 2022.
Unlike 2022, when only the price of cranberries fell from what they cost the previous year, 2023 saw a larger number of price declines among the items on the AFBF's shopping list. In addition to turkey, the prices for milk, cranberries, pie shells, cubed stuffing, whipping cream, and green peas were lower than their 2022 prices. Altogether, these items saw their prices collectively fall by $3.18.
Meanwhile, the prices of the 1-pound veggie tray, rolls, sweet potatoes, and pumpkin pie mix rose by a combined $0.30. The total net change is a reduction of $2.88, of which the $1.61 decline in the price of a 16-pound turkey is the biggest component, accounting for 56% of the year-over-year difference.
From 2011 through 2020, the cost of a traditional Thanksgiving dinner held steady within a relatively narrow range between $46.90 (2020) and $50.11 (2015). The cost of a traditional Thanksgiving dinner for 10 people remains 30% higher than 2020's level thanks largely to President Biden's inflation.
References
American Farm Bureau Federation. Farm Bureau: Survey Shows Thanksgiving Dinner Cost Up 14%. [Online Article]. 18 November 2021.
American Farm Bureau Federation. Thanksgiving Dinner Cost Survey: 2022 Year to Year Prices. [PDF Document]. 17 November 2022.
American Farm Bureau Federation. Thanksgiving Dinner Cost Relief, But Still High Relative to Recent Years. [Online Article]. 15 November 2023.
Image Credit: Thanksgiving Dinner. Public domain image by U.S. Department of Health and Human Services via U.S. Census Bureau.
Labels: food, inflation, personal finance, thanksgiving

In 2022, American poultry farmers were in crisis.
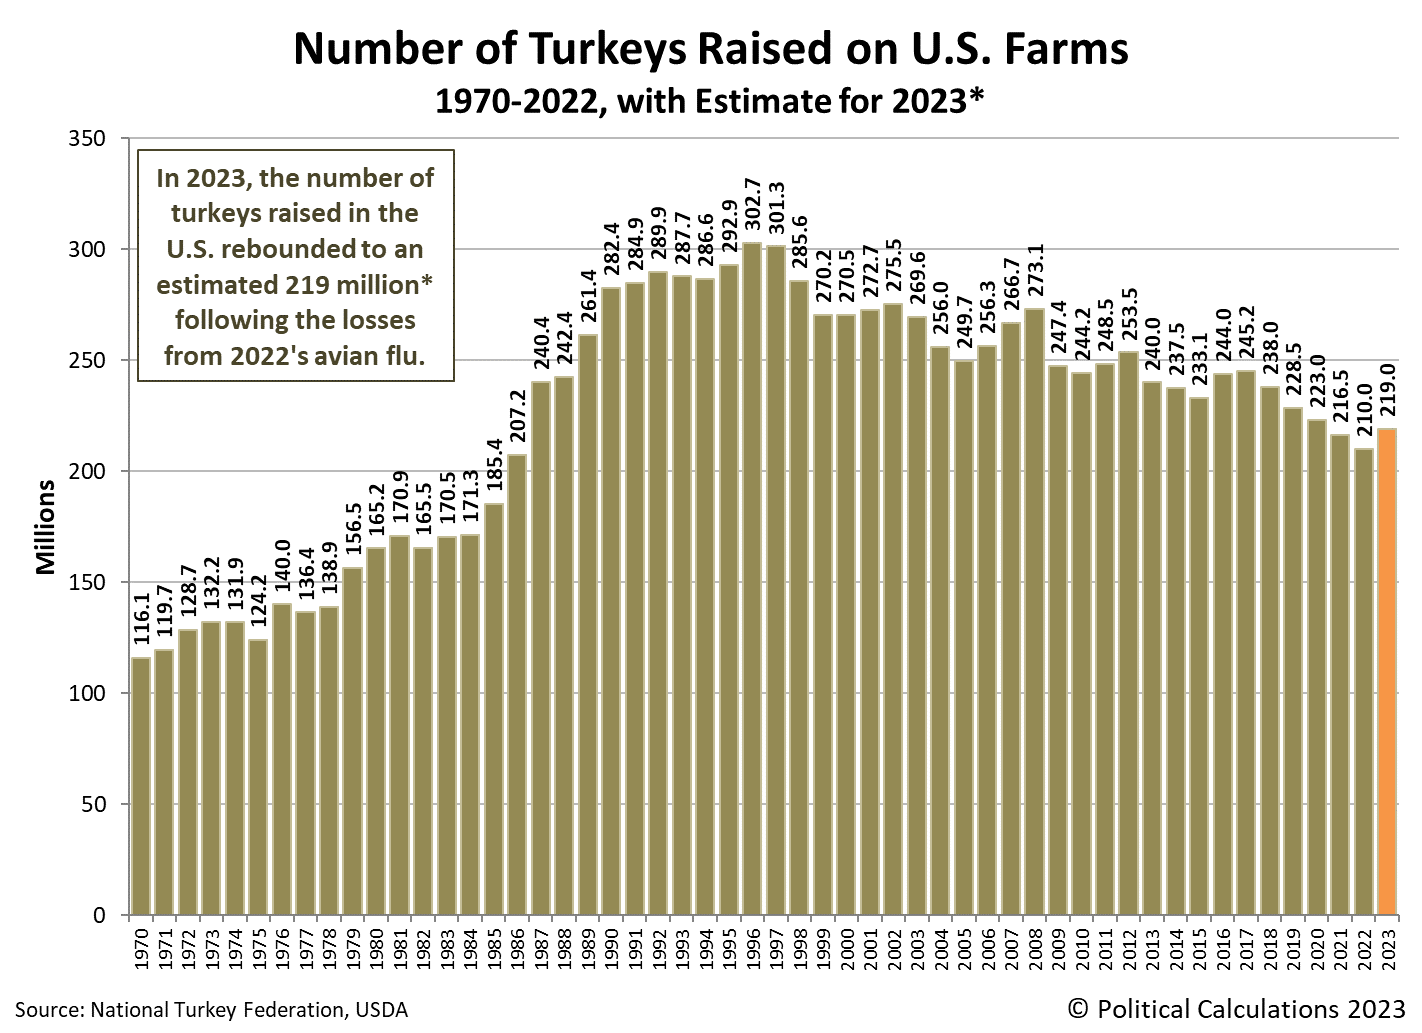
Thanks to outbreaks of Highly Pathogenic Avian Influenza (HPAI), entire flocks of chickens and turkeys on U.S. farms had to be culled to limit the spread of the highly infectious and deadly virus in early 2022. Before its spread abated, HPAI claimed the lives of approximately 36 million chickens, turkeys, and other game birds raised on U.S. farms. Among U.S. turkey producers, the population of turkeys plummeted from 216.5 million in 2021 to 210 million in 2022.
But in 2023, the domesticated turkey population rebounded to an estimated 219 million. That puts the number of turkeys raised in the United States back up the the level it was between 2020 and 2021.
That's also the third-lowest figure recorded since 1987, when the low-fat diet craze of the 1980s prompted a surge of demand for turkey among American consumers. It is also generally in line with the downward trend that has been in place since 1996, when the population of farm-raised turkeys peaked at 302.7 million.
The U.S. Department of Agriculture estimates the average weight of a live turkeys being raised on U.S. farms in 2023 is 32.0 pounds (14.5 kg). That figure is up from the 31.7 pounds (14.4 kg) recorded in 2022, but falls a little over three percent below the record average live weight of 33.1 pounds (15.0 kg) set in 2021.
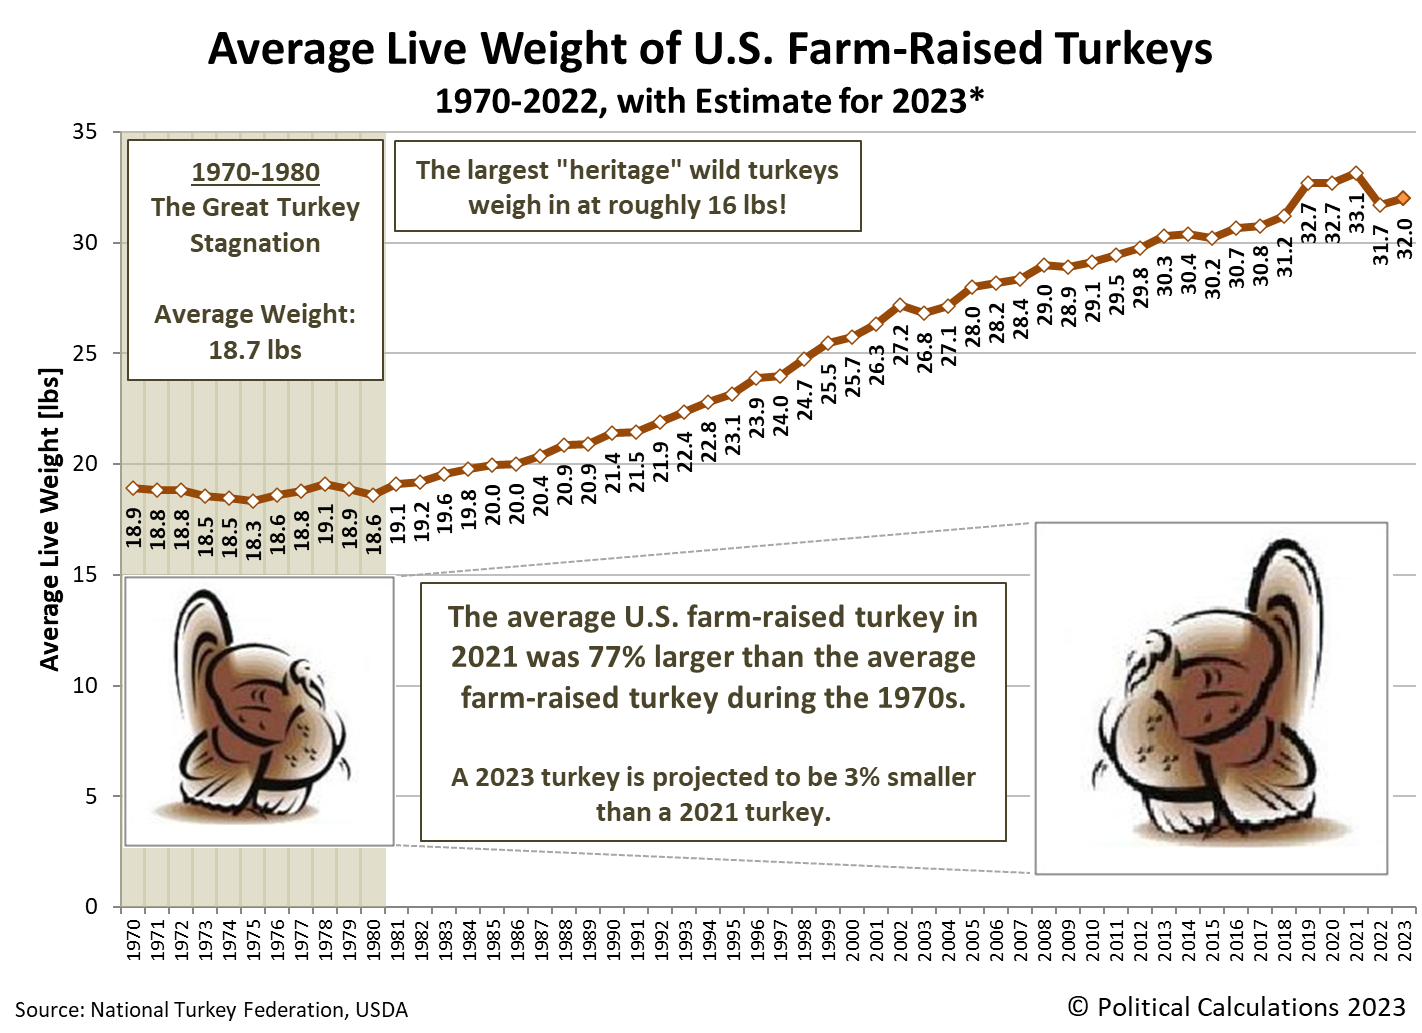
Assuming that average live weight estimate holds, the combined live weight of all turkeys raised in the U.S. during 2023 will total a little over 7 billion pounds (3.175 billion kg). That 5.3% increase from 2022's figure would be the fourth lowest annual total of the period since 1996, when U.S. turkey production first exceeded the 7.0 billion pound threshold.

The American Farm Bureau Federation puts the price of a 16-pound (7.26 kg) ready-to-cook turkey at $27.35 in 2023, which is down 5.6% from 2022's cost of $28.96. That figure however is over 41% more expensive than the $19.39 American consumers paid for the same size turkey in 2020.
Stay tuned for our next entry, when we'll look at the changing cost of a traditional Thanksgiving dinner since 2020.
References
U.S. Department of Agriculture. Turkeys Raised. [PDF Document]. 27 September 2023.
U.S. Department of Agriculture. Meat statistics tables, recent. Table 3 - Livestock and poultry live and dressed weights. [Excel Spreadsheet]. 27 October 2023.
U.S. Department of Agriculture. Poultry - Production and Value. 2022 Summary. [PDF Document]. April 2023.
U.S. Department of Agriculture. World Agricultural Supply and Demand Estimates (WASDE - 642). U.S. Quarterly Animal Product Production. Nov Proj. Turkey (Ready To Cook Weight, millions of pounds). [PDF Document]. 9 November 2023.
Image credit: Microsoft Bing Image Creator. Prompt: "farm turkeys, photograph, highly detailed, photorealistic, 4k, digital art concept".
Labels: food, thanksgiving, turkey

We haven't yet seen the iteration of the CSI: Crime Scene Investigation television franchise that rips this story from the headlines, but in 2007, turkey DNA was instrumental in proving the guilt of a criminal.
We had high hopes when we first saw the headline Utah State University Helps Solve Iowa Turkey Crime. Could it be that the crime being investigated involved a frozen turkey leg used as a murder weapon that was subsequently cooked in an effort to destroy evidence by serving it to the police who were investigating it? But no, it was nothing so dramatic. The crime in question involved poaching, where the murder victims were themselves wild turkeys.
Here's the key to how the Utah State University researchers cracked the case:
When game wardens served a search warrant on Iowa hunter Justin Jones, they found five packages of turkey meat. They suspected Jones used a 12-gauge shotgun to poach wild turkeys.
He beat a similar rap once before because no one could prove the meat came from wild turkeys instead the grocery store. This time authorities shipped meat samples to Utah State where they have the only nationwide wild turkey DNA database.
Who knew we needed one? But in this case it was invaluable. Samples from Justin Jones' private stash of turkey meat matched the DNA of wild turkey. "It was pretty convincing that they were, in fact, poached, that they were not domestic turkeys," genetics lab manager Carol Rowe said.
There was more to it than just comparing DNA matches to samples in USU's database. Here's how the Utah State researchers described how they got their man.
Roberg contacted Mock, who agreed to help with the investigation – but she needed help. Mock required DNA samples from known wild turkeys in the same geographic region as the suspected poached birds.
“If you’re showing a particular bird came from a particular population, you have to figure out the probability that this genotype came from your target population rather than from some other population,” says Mock, assistant professor in USU’s Department of Wildland Resources.
With help from Iowa conservation officers and state DNR personnel 78 samples were collected and shipped to USU’s lab. Mock and her team went to work and discovered that the samples seized from the suspect’s freezer showed a high probability of coming from the Iowa wild turkey population.
In the end, they had the suspect dead to rights, leading to perhaps the most boring legal outcome possible:
In October, Jones entered a guilty plea in court and was ordered to pay fines and court costs plus $1,000 toward the cost of USU’s efforts.
This 15-year old case is surprising in many ways. But perhaps the most surprising is how low the cost of doing DNA analysis had become. Consider the following:
- There is an exclusive database with the DNA samples of both wild and domesticated turkeys.
- It is worthwhile for conservation officers to call up the equivalent of CSI: Wild Turkeys for assistance in resolving criminal cases.
DNA analysis has become even cheaper since. Offenders committing turkey-related crimes should beware!
Image Credit: Stable Diffusion DreamStudio Beta - "A cooked turkey in a laboratory, beside a microscope, scientists".
Labels: crime, technology, thanksgiving
Welcome to the blogosphere's toolchest! Here, unlike other blogs dedicated to analyzing current events, we create easy-to-use, simple tools to do the math related to them so you can get in on the action too! If you would like to learn more about these tools, or if you would like to contribute ideas to develop for this blog, please e-mail us at:
ironman at politicalcalculations
Thanks in advance!
Closing values for previous trading day.
This site is primarily powered by:

CSS Validation

RSS Site Feed

JavaScript
The tools on this site are built using JavaScript. If you would like to learn more, one of the best free resources on the web is available at W3Schools.com.
Other Cool Resources
Blog Roll


