
Imagine this scenario. You've just left your old job, but you still have a 401(k) retirement savings account at your former employer into which you had been making pre-tax contributions. You're ready to move that money into an Individual Retirement Account (IRA) where you're thinking about rolling it over into a Roth IRA so it can grow completely tax free into the future. But if you do, you'll have to pay income taxes on the amount you roll over, which you'll have to have withheld out of the money that's in your pre-tax account because you don't have the cash to otherwise pay them.
How much of those pre-tax savings will you have to have withheld to pay those income taxes? And how long will it take you to recover that money with the tax-free growth of the post-rollover amount invested in the Roth IRA?
Believe it or not, these are questions that many Americans may find they need to answer several times during the course of their working lives. In 2025, about half of working Americans were contributing money directly from their paychecks to 401k-type plans through their employers, with most making their contributions on a pre-tax basis.
At the same time, about half of Americans will change employers after about four years on the job. If they've been making pre-tax contributions to their retirement savings, they'll have these exact questions.
Which is why we've built the following tool! Here, we'll need you to enter the amount of money you might be looking to convert from a pre-tax retirement savings account to a Roth IRA and your marginal income tax rate for the tax year in which you'll make the change, assuming the taxes withheld will have to come out of your accumulated pre-tax retirement savings. We'll then estimate the amount of taxes to be withheld and how long your tax-free savings will take to recover back to your pre-tax savings amount. If you're reading this article on a site that republishes our RSS news feed, click here to access a working version of this tool!
In using this tool, the marginal federal tax rate is the one that applies when you add the amount of pre-tax income you're seeking to roll over into a Roth IRA to your expected taxable income for the year. For our default example, we've set the marginal federal income tax rate to be 22%, which applies to the following taxable income amounts for the indicated income tax filing status:
- Single or Married filing separately: $48,476 - $103,350
- Married filing jointly: $96,951 - $206,700
- Head of household: $64,851 - $103,350
The expected growth rate of the tax-free investment is set at 9%, which is rounded down from the average rate of return for an investment in the S&P 500 of any duration in the years since January 1871.
With these defaults and a pre-tax amount of $24,000, the tool finds the amount of income taxes to be withheld is $5,280, which reduces the amount of funds being rolled into a Roth IRA down to $18,720. If it grows at an average of 9% a year, the amount rolled into the Roth retirement account would take 2.88 years to recover its pre-tax value.
Since those default values may be very different from ones that might be relevant for you, you're welcome to change them to ones that apply for whatever scenario you'd like to consider.
In Part 2, we'll use the same math to explore a different scenario for executing a pre-tax to Roth rollover that can lead to a potentially better outcome for investors considering executing this kind of strategy.
Image Credit: Microsoft Copilot Designer. Prompt: "A digital art concept of a pre-tax retirement account being rolled over into a Roth IRA that shows income taxes being paid out of the pre-tax retirement account".
Labels: investing, personal finance, taxes, tool



The pace at which human carbon dioxide emissions are accumulating in the Earth's air fell in May 2026, continuing a long downward trend that began in January 2025. The trailing 12-month average of the year-over-year change in atmospheric CO₂ concentration was 2.22 parts per million.
That's a reduction of 1.36 parts per million, or about 38%, from the modern-era record of 3.57 parts per million recorded in December 2024. The change coincided with a sharp slowdown in China's economic output following boosted production aimed at beating expanded tariffs and trade restrictions on the nation's exports. In recent months, newer geopolitical events like the Iran war and its disruption of oil shipping through the Hormuz Strait has also contributed to the decline.
The main impact of Iran war's disruption of oil shipping has increased pressures on nations whose supply of oil originates from Iran and other nations in the affected region. For China, much of that impact has been mitigated by tapping the nation's strategic oil reserves and shifting to alternative energy production methods to offset it. China's lowered economic output from the global tariff war has also reduced its demand for energy.
Similar factors have affected other nations whose oil supplies have been disrupted by the geopolitical event, though their CO₂ emissions are considerably smaller than those of China.
The slowdown is evident in atmospheric carbon dioxide concentration data because China is, by a very wide margin, the world's leading producer of carbon dioxide emissions. The following chart shows how this measure has changed from January 2000 through May 2026:

The following tool gives an estimate of how much economic activity in worldwide (and predominantly in China) has declined since December 2024. If you're accessing this article on a site that republishes our RSS news feed, please click through to our site to access a working version.
The tool's estimates are based on Jenny Cederborg's and Sara Snöbohm's 2016 paper. In their research, they investigated whether there is a relationship between economic growth and carbon dioxide emissions and identified a positive correlation between CO₂ emissions and GDP per capita. They found "CO₂ emissions increase by approximately 0.0002 [metric] tons (0.2 kg) per capita when GDP per capita increase by 1 dollar, holding all other variables constant".
That relationship doesn't take the effects of inflation into account, so the tool's results based upon it are likely understating the real reduction in global GDP associated with the reduced economic activity indicated by the reduction in CO₂ emissions.
That said, global GDP for 2024 is estimated to be around $110 trillion, which means the indicated global GDP reduction of $45.2 trillion since December 2024 is substantial.
Update 12 June 2026
Late breaking headline on global GDP growth: "World Bank cuts global growth outlook to 2.5%, warns of drop to 1.3% if war fallout spreads to markets".
If only there was some indicator to see how the Earth's economy is doing in near-real time!
References
National Oceanographic and Atmospheric Administration. Earth System Research Laboratory. Mauna Loa Observatory CO2 Data. [Online Data]. Updated 5 June 2026.
Cederborg, Jenny and Snöbohm, Sara. Is there a relationship between economic growth and carbon dioxide emissions? Semantic Scholar. [PDF Document]. 2016.
Image credit: Stable Diffusion DreamStudio Beta. Prompt: "Digital art concept of carbon dioxide emissions being used to measure economic growth."
Labels: environment, tool

In the United States, when people talk about mortgages, they almost invariably are talking about the 30-year fixed-rate conventional mortgage.
It wasn't always that way. In fact, it wasn't until the Housing Act of 1954 became law that the 30-year fixed rate mortgage became mainstream. The law's "combination of federal insurance and full amortization requirements made the extended timeline financially safe for banks". Soon after, the 30-year fixed rate conventional mortgage became the default for both lenders and home buyers.
But it wasn't until much later that federally-backed agencies like Freddie Mac began keeping regular track of what the average monthly interest rate was for homes bought in the U.S. with these mortgages. As important as they are for prospective American homeowners, the historical data for these mortgages only goes back to April 1971. Freddie Mac, officially known as Federal Home Loan Mortgage Corporation, has maintained weekly data for mortgages extending back to that month. The government-sponsored enterprise also used to report monthly averages for mortgage rates from April 1971 forward, but discontinued the practice after December 2022.
And yet, because housing sales and prices are reported on a monthly basis, it's incredibly useful to have mortgage rates averaged over the period of a month. Since Freddie Mac isn't doing that job any more, we took it over and have made it publicly available.
It's built into the following interactive chart, which we've just updated to visualize 55 years worth of the average monthly interest rates for 30-year conventional mortgages in the U.S.
The average 30-year fixed-rate conventional mortgage was 6.33% in April 2026.
References
Freddie Mac. 30-Year Fixed Rate Mortgages Since 1971. [Online Database]. Accessed 15 May 2026. Note: Starting from December 2022, the estimated monthly mortgage rate is taken as the average of weekly 30-year conventional mortgage rates recorded during the month.
Image credit: Mortgage Payment Due date by alanharder.ca via Wikimedia Commons. Creative Commons Attribution 2.0 Generic (CC BY 2.0).
Labels: data visualization, real estate, tool

U.S. Income Tax Day arrives on April 15 in 2026. And since you've probably been racing to complete your 2025 federal income tax returns, what better way could there be to celebrate the most dreaded day on the American calendar than by filling out yet another income tax form?
Before you start pounding the back button or swiping left, there's nothing for you to worry about! You won't have to pay any more income taxes than what you already have reported on whichever version of IRS Form 1040 you're filing this year. Instead, we've built the following tool to transport you in time back to 1913, where our tool will estimate how much your federal income taxes would be if that year's income tax rules still applied.
Why 1913? That's the year the Internal Revenue Service first issued its infamous Form 1040. We've modeled our tool after the first page of the original Form 1040, which back then, consisted of just four pages:
- The summary sheet modeled below (Page 1),
- the Gross Income calculation sheet (Page 2),
- the General Deductions sheet (Page 3), and finally,
- one page of Instructions (Page 4).
Yes, you read that right. Paying U.S. income taxes used to only require one page of instructions!
We'll make it even easier. All you need to do is to enter the indicated data (shown in boldface type, in the rows with a white background), using your figures from this year that should still be very fresh in your memory, and we'll take care of the math! The tool will display its calculated results in the rows with a gray background, where you won't have to worry about entering any values.
If you are accessing this article on a site that republishes our RSS news feed, please click here to access a working version of the tool on our site. Now, if you're ready, let's get to it!...
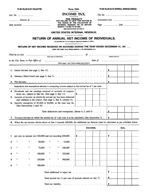
Here are several excerpts from the instructions for filling out the original IRS Form 1040, which explain some of the math our tool is doing.
Excerpts from the Instructions
3. The normal tax of 1 per cent shall be assessed on the total net income less the specific exemption of $3,000 or $4,000 as the case may be. (For the year 1913, the specific exemption allowable is $2,500, or $3,333.33, as the case may be.) If, however, the normal tax has been deducted and withheld on any part of the income at the source, or if any part of the income is received as dividends upon the stock or from the net earnings of any corporation, etc., which is taxable upon its net income, such income shall be deducted from the individual's total net income for the purpose of calculating the amount of income on which the individual is liable for the normal tax of 1 per cent by virtue of this return.
19. An unmarried individual or a married individual not living with wife or husband shall be allowed an exemption of $3,000. When husband and wife live together they shall be allowed jointly a total exemption of only $4,000 on their aggregate income. They may make a joint return, both subscribing thereto, or if they have separate incomes, they may make separate returns; but in no case shall they jointly claim more than $4,000 exemption on their aggregate income.
Previously on Political Calculations
Haven't had enough taxes yet? Here's a couple of other tools that might be of interest to you!
Image credit: Stable Diffusion DreamStudio Beta: "A greedy Uncle Sam wants to make Americans pay taxes".

When the price of fuel soars, drivers who seek to avoid spending money on petroleum have two options. They can:
- Drive less, or
- Slow down.
For many, driving less is an obvious solution, but one that isn't necessarily achievable. That's comes down to why people have cars in the first place. They need them to travel to and from work and also to and from where they buy the goods and services they need.
In today's world, whether they drive a gas-powered, battery-powered or hybrid vehicle, some non-zero percentage of the fuel or energy needed to enable their ride will be produced by fossil fuels. When the price of oil and other fossil fuels rise, the cost of essential commuting goes up as well. But you can limit your exposure to those higher costs by slowing down to drive your vehicle at speeds where it is more efficient.
That fact was established by a nearly three-decade old study by the U.S. Department of Energy that found that most gasoline-powered vehicles in the U.S. are operated at speeds at which they do achieve their peak level of fuel efficiency. At highway speeds, for instance, the forces of aerodynamic drag can substantially increase the amount of fuel an automobile engine has to burn in order to sustain a high velocity. A simple back-of-the-envelope calculation reveals that the amount of drag force that a car being driven at 75 miles per hour sees is some 33% higher than the same car being driven at 65 miles per hour would see.
Though today's roads have more electric and hybrid vehicles driving upon them, they are still affected by the same laws of aerodynamics. Like gas-powered vehicles, it takes less energy to sustain them moving at lower speeds, which means their batteries can hold their charges for longer.
But not too slow. Driving too slow also comes not just with a time penalty but also an increased penalty for fuel consumption. Most modern vehicles are designed to operate most efficiently at speeds ranging from 30 to 55 miles per hour. That's the sweet spot in which you can get the most distance driving out for your fuel consumption dollar.
We've tapped that old study to reverse-engineer the Fuel Economy vs Speed average vehicle profile developed by the U.S. Department of Energy and create the following tool, in which you can find out who much money you might save by going slower. If you're accessing this tool on a site that republishes our RSS news feed, please click through to our site to access a working version of the tool.
The cool thing about this tool is that you now have more weapons in your arsenal to help fend off the effects of higher gasoline prices! Armed with this information, you can now make whatever trade-offs you might need to your greatest advantage. For example, if getting the greatest possible savings is most important to you, you'll want to drive at speeds that produce the lowest equivalent cost per gallon of gas compared to your normal driving speeds. If you want to save gas money and time, you'll want to drive at speeds that give you the greatest equivalent "tax free" income compared to how you drive today.
Image credit: Lighted Automotive RPM, Temperature, Fuel, and Speedometer Gauges photo by Kevin kevin on Unsplash.
Labels: gas consumption, gas prices, personal finance, tool

How much money will the U.S. government let you keep out of each of your regular paychecks in 2026?
2025 saw big changes to U.S. income taxes, mainly in the form of the One Big Beautiful Bill Act making the income tax cuts that were originally passed in 2017 and set to expire at the end of 2025 permanent. Without those changes, nearly all Americans would have been in for an income tax shock in 2026.
If they hadn't been, the higher income tax rates that prevailed back in 2017 would have come back into full force. If you're like many Americans, chances are you wouldn't have noticed until you got your first paycheck in the new year. That would be when you would direct evidence of how much more ol' Uncle Sam is gouging you. Fortunately, that nasty situation was avoided and the changes to how much the U.S. government is taking out of every one of your paychecks are pretty small by comparison. Compared to 2025, the various withholding levels have been adjusted for inflation and that's about all.
But inflation adjustments may not be the only changes that affect the bottom line of your paycheck. If you changed the contribution percentage to your 401(k) or 403(b) retirement savings plans, both the amount that goes these plans and the amount of your federal withholding taxes will change. Likewise if you use changed your contributions for a tax-deferred flexible spending account for covering your dependent or health care expenses.
Your 2026 paycheck may also see a change to its top line. If you get a raise, for example, that will affect the bottom line of your paycheck. The question is how much.
Our 2026 paycheck tool can help you find out what your paycheck will look like before you even see your first paycheck of the year! If you're reading this article on a site that republishes our RSS news feed, please click through to our site to access a working version of the tool. Otherwise, you're more than welcome to enter whatever numbers you want to consider for what your paychecks might look like in 2026.
But if you really want to see something, after you run the numbers for 2026, please check out our paycheck tool using 2017's income tax rates with your 2026 income to get an indication of how different your paycheck could have been without the One Big Beautiful Bill Act of 2025.
The tool's results convey how much money the IRS withholds for federal taxes from each of your paychecks in 2026. There are however a number of factors that will complicate your withholding tax results based upon how much you cumulatively earn during the year.
For example, once your cumulative income reaches $184,500 or higher, you will no longer have Social Security's payroll tax of your income deducted from your paycheck, which is 6.2% if you're an employee, but which doubles to 12.4% if you're self-employed (the self-employed pay both the employee and employer payroll taxes). Our tool is designed to provide withholding tax estimates for the majority of Americans who are employed by others. People making this amount of money don't really get a break however because they've already been pushed into a higher tax bracket - they are paying higher regular income tax rates than those paid by over half of all income-earning American households.
There's also the complication provided by the so-called "Additional Medicare Tax" that your employer is required to begin withholding from your paycheck if, and as soon as, your year-to-date income rises above the $200,000 mark. This surtax of 0.9% of gross income was imposed by the "Affordable Care Act" (a.k.a. "Obamacare") in 2010, which is still in effect. Since the money collected through this surtax does not directly support the Medicare program, unlike the real Medicare payroll taxes paid by you and your employer, it is really best thought of as an additional income tax. That additional income tax is not adjusted for inflation, which means that those who must pay it are subject to 1970s-style income tax bracket creep, even though the tax was sold on the claim that it would be limited to only very high income earners.
In the tool above, when the amount of your annual 401(k) or 403(b) retirement savings contributions exceed the annual limits set by law, we've limited the results our tool provides to be those consistent with their statutory limits, and will do so as if you specifically set the percentage contributions for these contributions with that in mind. Our tool does not consider whether you might take advantage of the "catch-up" provisions in the law that are available to individuals Age 50 or older. For example, individuals Age 50 to 59 can increase their annual contributions by $8,000 in 2026 (up from $7,500 in 2025). Meanwhile, individuals Age 60 to 63 can contribute up to an extra $11,250 beyond the standard maximum contribution to their tax-deferred retirement savings account.
Elsewhere on the Web
There are other salary and hourly paycheck calculators like this on the Internet, including the very well done tools available at PaycheckCity.com. PaycheckCity's State Salary Paycheck Calculators allow you to determine the amount of state income tax withholding that will be taken out of your paycheck in addition to what the federal government will take out. Payroll processing giant ADP also has a salary paycheck calculator that will give you good results. We still find the format of PaycheckCity's calculators to be more user friendly, but ADP's version has the benefit of having an all-in-one user interface.
If however you live in one of the states that have no taxes on earned income (Alaska, Florida, Nevada, New Hampshire, South Dakota, Tennessee, Texas, Washington, or Wyoming), our tool above will provide you with a very good estimate of your actual take-home pay after Uncle Sam has gotten his dirty ape paws all over it.
Previously on Political Calculations
We've been in the business of calculating people's paychecks (not including state income tax withholding) since 2005!
- Your 2005 Paycheck
- Your 2006 Paycheck
- Your 2007 Paycheck
- Your 2008 Paycheck
- Your 2009 Paycheck
- Your Paycheck in 2010
- Your Paycheck in 2011
- Your Paycheck in 2012
- Your Paycheck in 2013: Part 1 - the "same as 2012" version.
- Your Paycheck in 2013: Part 2 - the "over the fiscal cliff" version.
- Your Paycheck in 2013: Part 3 - the "post-fiscal cliff deal" version.
- Your Paycheck in 2014
- Your Paycheck in 2015
- Your Paycheck in 2016
- Your Paycheck in 2017
- Your Paycheck in 2018, Before the Tax Cuts Kick In
- Your Paycheck in 2018, After the Tax Cuts Kick In
- The Bottom Line for Your 2018 Paycheck After the Tax Cuts
- Your Paycheck in 2019
- Your Paycheck in 2020
- Your Paycheck in 2021
- Your Paycheck in 2022
- Your Paycheck in 2023
- Your Paycheck in 2024
- Your Paycheck in 2025
- Your Paycheck in 2026
Image Credit: Microsoft Copilot Designer. Prompt: "An editorial cartoon of a boss and Uncle Sam sitting at a table marked as 'PAYROLL'. The boss is setting out stacks of cash to pay employees and Uncle Sam is taking part of that money."
Labels: personal finance, taxes, tool
Welcome to the blogosphere's toolchest! Here, unlike other blogs dedicated to analyzing current events, we create easy-to-use, simple tools to do the math related to them so you can get in on the action too! If you would like to learn more about these tools, or if you would like to contribute ideas to develop for this blog, please e-mail us at:
ironman at politicalcalculations
Thanks in advance!
Closing values for previous trading day.
This site is primarily powered by:

CSS Validation

RSS Site Feed

JavaScript
The tools on this site are built using JavaScript. If you would like to learn more, one of the best free resources on the web is available at W3Schools.com.
Other Cool Resources
Blog Roll


