
Did you know that...
- if you rent, you're paying the property owner's income and property taxes?
- if you buy food, you're paying a farmer's income and property taxes?
- if you fly, you're paying the airline's income taxes, payroll taxes, and property taxes? And also the airline employees' income taxes and payroll taxes?
- if you buy a product made outside the country, you're paying an importer's tariffs and customs duties? In addition to their income and property taxes?
- if you buy a product, you're paying the maker's income and property taxes?
- if you borrow money, you're paying your lender's income and property taxes?
It would be more accurate to say you're paying a portion of the other party's taxes for each of these items and not all their taxes, but you get the idea.
Exit question: Have you paid your fair share of their taxes?
Image credit: Microsoft Copilot Designer. Prompt: "An editorial cartoon of a giant iceberg labeled 'Hidden Taxes.' Above the water, only a tiny tip is visible and labeled 'Sales Tax.' Below the waterline is a massive submerged iceberg labeled with: 'Business Income Tax,' 'Property Tax,' 'Payroll Tax,' 'Regulatory Costs,' 'Licensing Fees,' 'Import Duties,' and 'Fuel Taxes.' In the foreground, a family at a grocery checkout studies a receipt and notices only the small sales tax line. Arrows from the hidden underwater taxes flow upward into grocery price tags and consumer goods. Caption: The tax you see is often the smallest one you pay."


We first wrote about Hauser's Law in 2009. At the time, we described it as "one of the stranger phenomenons in economic data". The law itself was proposed by W. Kurt Hauser in 1993, who observed:
No matter what the tax rates have been, in postwar America tax revenues have remained at about 19.5% of GDP.
In 2009, we found total tax collections the U.S. government averaged 17.8% of GDP in the years from 1946 through 2008, with a standard deviation of 1.2% of GDP. Six years later, we revisited it once again and found that while the standard deviation was the same, average total tax collections from 1946 through 2018 was lowered to 16.8% of GDP because of 2013's comprehensive revision of GDP that significantly boosted historic GDP estimates after the basic GDP formula was redefined.
Seven years later, we're revisiting the historic data once again to see if it still holds. Spoiler alert: it does!
Here's a triple-set of charts to show off Hauser's Law in action!

Since we're now spanning 80 years worth of data, during which the U.S.' maximum income tax rate has ranged between 28% and 92% of income, we confirm once again that the U.S. government's total tax collections have averaged 16.8% with a standard deviation of 1.2% of GDP from 1946 through 2025. If you know your normal distribution bell curve from statistics, that means over 99% of the U.S. government's total tax collections from 1946 through 2026 would be expected to fall between 13.2% and 20.4% of GDP, which they have.
The pattern also holds true for U.S. personal income tax collections, although here, the average is 7.7% of GDP and the standard deviation is 0.8% of GDP.
What all these numbers mean is that the U.S. government's tax collections have been remarkably stable as a percent of GDP, or the national income, over the last eight decades, regardless of how the top income tax rate has been set. We think that represents a political equilibrium, especially as higher rates of tax collections have not been able to be sustained.
There are just four periods where tax collections rose more than one standard deviation above the mean level, none of which proved to be sustainable.
- In 1968, the Democratic U.S. Congress and President Lyndon Johnson passed a shock 10% income surtax that took effect in mid-year, spiking the top tax rate from 70% to 77% and increasing the amount collected from top income tax earners by an additional 10%. Coupled with a spike in inflation, for which personal income taxes were not adjusted to compensate, this tax hike led to outsize income tax collections in that year.
- The sustained high inflation of 1978 (7.62%), 1979 (11.22%), 1980 (13.58%) and 1981 (10.35%) led to higher tax collections through bracket creep, as income tax brackets in the U.S. were not adjusted for inflation until 1985 as part of President Ronald Reagan's first term Economic Recovery Tax Act.
- Beginning in April 1997, a cut in the capital gains tax rate caused the Dot Com Stock Market Bubble to being inflating. As it expanded, the bubble minted a large number of new millionaires as investors swarmed to participate in Internet and "tech" company initial public offerings or private capital ventures, which in turn, inflated personal income tax collections. Unfortunately, like the vaporware produced by many of the companies that sprang up to exploit the investor buying frenzy, the illusion of prosperity could not be sustained and tax collections crashed with the incomes of the Internet titans in the bursting of the bubble, leading to the recession that followed. It eventually came to an end in 2003 after the capital gains tax rate was increased to be equal to the dividend tax rate once again.
- In 2022, tax collections spiked with the recovery from the coronavirus pandemic after government-mandated lockdowns and restrictions on businesses were lifted.
There's one final piece of the puzzle we haven't tackled, and that's why the U.S. national debt has grown so large even as federal tax collections have been so relatively stable. Here we find three factors that have contributed to its growth:
- The launch of Medicare in 1965 coincides with a period in which government spending no longer drops below the long-term average of tax collections. Before Medicare was passed into law, government spending only surged above that level when wars were fought, dropping back to pre-war levels after they ended. World War 2 is a classic example, with its drawdown in spending taking place in the years after it ended in 1945. The 1980s Cold War defense buildup also shows the same pattern, with spending returning to pre-buildup levels as a percent of GDP in the 1990s as a peace dividend.
- The Great Financial Crisis of 2008 led to massive bailouts by the U.S. government. Even though that crisis ended, spending failed to return to its pre-crisis level because President Obama's Affordable Care Act permanently inflated the government's spending from 2014 onward.
- The Coronavirus Pandemic of 2020 led to massive government subsidies to offset the impact of the extreme economic disruption caused by state and local government lockdowns. However, two Biden administration initiatives combined to permanently inflate government spending above their pre-crisis levels: the American Recovery Act with its inflationary impact and the cynically-named Inflation Reduction Act that further boosted spending. These two initiatives kept government spending elevated at levels far above what the U.S. government can reasonably expect to collect in taxes based on the last 80 years of experience.
And that, in a nutshell, is why the U.S. government has gone from running mostly balanced budgets in the years before 1965 to running consistently in the red in the years since with few exceptions. The upward ratcheting of government spending in the years since 1965, and particularly since 2008 to levels far above what the U.S. government is capable of sustaining through its stable tax collections is why the national debt has grown to exceed $40 trillion.
Previously on Political Calculations
Labels: data visualization, taxes

Imagine this scenario. You've just left your old job, but you still have a 401(k) retirement savings account at your former employer into which you had been making pre-tax contributions. You're ready to move that money into an Individual Retirement Account (IRA) where you're thinking about rolling it over into a Roth IRA so it can grow completely tax free into the future. But if you do, you'll have to pay income taxes on the amount you roll over, which you'll have to have withheld out of the money that's in your pre-tax account because you don't have the cash to otherwise pay them.
How much of those pre-tax savings will you have to have withheld to pay those income taxes? And how long will it take you to recover that money with the tax-free growth of the post-rollover amount invested in the Roth IRA?
Believe it or not, these are questions that many Americans may find they need to answer several times during the course of their working lives. In 2025, about half of working Americans were contributing money directly from their paychecks to 401k-type plans through their employers, with most making their contributions on a pre-tax basis.
At the same time, about half of Americans will change employers after about four years on the job. If they've been making pre-tax contributions to their retirement savings, they'll have these exact questions.
Which is why we've built the following tool! Here, we'll need you to enter the amount of money you might be looking to convert from a pre-tax retirement savings account to a Roth IRA and your marginal income tax rate for the tax year in which you'll make the change, assuming the taxes withheld will have to come out of your accumulated pre-tax retirement savings. We'll then estimate the amount of taxes to be withheld and how long your tax-free savings will take to recover back to your pre-tax savings amount. If you're reading this article on a site that republishes our RSS news feed, click here to access a working version of this tool!
In using this tool, the marginal federal tax rate is the one that applies when you add the amount of pre-tax income you're seeking to roll over into a Roth IRA to your expected taxable income for the year. For our default example, we've set the marginal federal income tax rate to be 22%, which applies to the following taxable income amounts for the indicated income tax filing status:
- Single or Married filing separately: $48,476 - $103,350
- Married filing jointly: $96,951 - $206,700
- Head of household: $64,851 - $103,350
The expected growth rate of the tax-free investment is set at 9%, which is rounded down from the average rate of return for an investment in the S&P 500 of any duration in the years since January 1871.
With these defaults and a pre-tax amount of $24,000, the tool finds the amount of income taxes to be withheld is $5,280, which reduces the amount of funds being rolled into a Roth IRA down to $18,720. If it grows at an average of 9% a year, the amount rolled into the Roth retirement account would take 2.88 years to recover its pre-tax value.
Since those default values may be very different from ones that might be relevant for you, you're welcome to change them to ones that apply for whatever scenario you'd like to consider.
In Part 2, we'll use the same math to explore a different scenario for executing a pre-tax to Roth rollover that can lead to a potentially better outcome for investors considering executing this kind of strategy.
Image Credit: Microsoft Copilot Designer. Prompt: "A digital art concept of a pre-tax retirement account being rolled over into a Roth IRA that shows income taxes being paid out of the pre-tax retirement account".
Labels: investing, personal finance, taxes, tool

U.S. Income Tax Day arrives on April 15 in 2026. And since you've probably been racing to complete your 2025 federal income tax returns, what better way could there be to celebrate the most dreaded day on the American calendar than by filling out yet another income tax form?
Before you start pounding the back button or swiping left, there's nothing for you to worry about! You won't have to pay any more income taxes than what you already have reported on whichever version of IRS Form 1040 you're filing this year. Instead, we've built the following tool to transport you in time back to 1913, where our tool will estimate how much your federal income taxes would be if that year's income tax rules still applied.
Why 1913? That's the year the Internal Revenue Service first issued its infamous Form 1040. We've modeled our tool after the first page of the original Form 1040, which back then, consisted of just four pages:
- The summary sheet modeled below (Page 1),
- the Gross Income calculation sheet (Page 2),
- the General Deductions sheet (Page 3), and finally,
- one page of Instructions (Page 4).
Yes, you read that right. Paying U.S. income taxes used to only require one page of instructions!
We'll make it even easier. All you need to do is to enter the indicated data (shown in boldface type, in the rows with a white background), using your figures from this year that should still be very fresh in your memory, and we'll take care of the math! The tool will display its calculated results in the rows with a gray background, where you won't have to worry about entering any values.
If you are accessing this article on a site that republishes our RSS news feed, please click here to access a working version of the tool on our site. Now, if you're ready, let's get to it!...
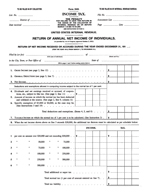
Here are several excerpts from the instructions for filling out the original IRS Form 1040, which explain some of the math our tool is doing.
Excerpts from the Instructions
3. The normal tax of 1 per cent shall be assessed on the total net income less the specific exemption of $3,000 or $4,000 as the case may be. (For the year 1913, the specific exemption allowable is $2,500, or $3,333.33, as the case may be.) If, however, the normal tax has been deducted and withheld on any part of the income at the source, or if any part of the income is received as dividends upon the stock or from the net earnings of any corporation, etc., which is taxable upon its net income, such income shall be deducted from the individual's total net income for the purpose of calculating the amount of income on which the individual is liable for the normal tax of 1 per cent by virtue of this return.
19. An unmarried individual or a married individual not living with wife or husband shall be allowed an exemption of $3,000. When husband and wife live together they shall be allowed jointly a total exemption of only $4,000 on their aggregate income. They may make a joint return, both subscribing thereto, or if they have separate incomes, they may make separate returns; but in no case shall they jointly claim more than $4,000 exemption on their aggregate income.
Previously on Political Calculations
Haven't had enough taxes yet? Here's a couple of other tools that might be of interest to you!
Image credit: Stable Diffusion DreamStudio Beta: "A greedy Uncle Sam wants to make Americans pay taxes".

How much money will the U.S. government let you keep out of each of your regular paychecks in 2026?
2025 saw big changes to U.S. income taxes, mainly in the form of the One Big Beautiful Bill Act making the income tax cuts that were originally passed in 2017 and set to expire at the end of 2025 permanent. Without those changes, nearly all Americans would have been in for an income tax shock in 2026.
If they hadn't been, the higher income tax rates that prevailed back in 2017 would have come back into full force. If you're like many Americans, chances are you wouldn't have noticed until you got your first paycheck in the new year. That would be when you would direct evidence of how much more ol' Uncle Sam is gouging you. Fortunately, that nasty situation was avoided and the changes to how much the U.S. government is taking out of every one of your paychecks are pretty small by comparison. Compared to 2025, the various withholding levels have been adjusted for inflation and that's about all.
But inflation adjustments may not be the only changes that affect the bottom line of your paycheck. If you changed the contribution percentage to your 401(k) or 403(b) retirement savings plans, both the amount that goes these plans and the amount of your federal withholding taxes will change. Likewise if you use changed your contributions for a tax-deferred flexible spending account for covering your dependent or health care expenses.
Your 2026 paycheck may also see a change to its top line. If you get a raise, for example, that will affect the bottom line of your paycheck. The question is how much.
Our 2026 paycheck tool can help you find out what your paycheck will look like before you even see your first paycheck of the year! If you're reading this article on a site that republishes our RSS news feed, please click through to our site to access a working version of the tool. Otherwise, you're more than welcome to enter whatever numbers you want to consider for what your paychecks might look like in 2026.
But if you really want to see something, after you run the numbers for 2026, please check out our paycheck tool using 2017's income tax rates with your 2026 income to get an indication of how different your paycheck could have been without the One Big Beautiful Bill Act of 2025.
The tool's results convey how much money the IRS withholds for federal taxes from each of your paychecks in 2026. There are however a number of factors that will complicate your withholding tax results based upon how much you cumulatively earn during the year.
For example, once your cumulative income reaches $184,500 or higher, you will no longer have Social Security's payroll tax of your income deducted from your paycheck, which is 6.2% if you're an employee, but which doubles to 12.4% if you're self-employed (the self-employed pay both the employee and employer payroll taxes). Our tool is designed to provide withholding tax estimates for the majority of Americans who are employed by others. People making this amount of money don't really get a break however because they've already been pushed into a higher tax bracket - they are paying higher regular income tax rates than those paid by over half of all income-earning American households.
There's also the complication provided by the so-called "Additional Medicare Tax" that your employer is required to begin withholding from your paycheck if, and as soon as, your year-to-date income rises above the $200,000 mark. This surtax of 0.9% of gross income was imposed by the "Affordable Care Act" (a.k.a. "Obamacare") in 2010, which is still in effect. Since the money collected through this surtax does not directly support the Medicare program, unlike the real Medicare payroll taxes paid by you and your employer, it is really best thought of as an additional income tax. That additional income tax is not adjusted for inflation, which means that those who must pay it are subject to 1970s-style income tax bracket creep, even though the tax was sold on the claim that it would be limited to only very high income earners.
In the tool above, when the amount of your annual 401(k) or 403(b) retirement savings contributions exceed the annual limits set by law, we've limited the results our tool provides to be those consistent with their statutory limits, and will do so as if you specifically set the percentage contributions for these contributions with that in mind. Our tool does not consider whether you might take advantage of the "catch-up" provisions in the law that are available to individuals Age 50 or older. For example, individuals Age 50 to 59 can increase their annual contributions by $8,000 in 2026 (up from $7,500 in 2025). Meanwhile, individuals Age 60 to 63 can contribute up to an extra $11,250 beyond the standard maximum contribution to their tax-deferred retirement savings account.
Elsewhere on the Web
There are other salary and hourly paycheck calculators like this on the Internet, including the very well done tools available at PaycheckCity.com. PaycheckCity's State Salary Paycheck Calculators allow you to determine the amount of state income tax withholding that will be taken out of your paycheck in addition to what the federal government will take out. Payroll processing giant ADP also has a salary paycheck calculator that will give you good results. We still find the format of PaycheckCity's calculators to be more user friendly, but ADP's version has the benefit of having an all-in-one user interface.
If however you live in one of the states that have no taxes on earned income (Alaska, Florida, Nevada, New Hampshire, South Dakota, Tennessee, Texas, Washington, or Wyoming), our tool above will provide you with a very good estimate of your actual take-home pay after Uncle Sam has gotten his dirty ape paws all over it.
Previously on Political Calculations
We've been in the business of calculating people's paychecks (not including state income tax withholding) since 2005!
- Your 2005 Paycheck
- Your 2006 Paycheck
- Your 2007 Paycheck
- Your 2008 Paycheck
- Your 2009 Paycheck
- Your Paycheck in 2010
- Your Paycheck in 2011
- Your Paycheck in 2012
- Your Paycheck in 2013: Part 1 - the "same as 2012" version.
- Your Paycheck in 2013: Part 2 - the "over the fiscal cliff" version.
- Your Paycheck in 2013: Part 3 - the "post-fiscal cliff deal" version.
- Your Paycheck in 2014
- Your Paycheck in 2015
- Your Paycheck in 2016
- Your Paycheck in 2017
- Your Paycheck in 2018, Before the Tax Cuts Kick In
- Your Paycheck in 2018, After the Tax Cuts Kick In
- The Bottom Line for Your 2018 Paycheck After the Tax Cuts
- Your Paycheck in 2019
- Your Paycheck in 2020
- Your Paycheck in 2021
- Your Paycheck in 2022
- Your Paycheck in 2023
- Your Paycheck in 2024
- Your Paycheck in 2025
- Your Paycheck in 2026
Image Credit: Microsoft Copilot Designer. Prompt: "An editorial cartoon of a boss and Uncle Sam sitting at a table marked as 'PAYROLL'. The boss is setting out stacks of cash to pay employees and Uncle Sam is taking part of that money."
Labels: personal finance, taxes, tool

About two-thirds of 2025 has come and gone. If your projected income for the year will push you into a higher tax bracket before it ends, you still have time to act to avoid that outcome.
As tax-related problems go, this is a good one to have. In this situation, your goal is to maximize the amount of money that you will keep under your control. If your income is on track to exceed a threshold that will put you into a higher tax bracket, Uncle Sam will take a bigger bite out of what you earn and that's what you want to avoid.
The first step to see if you'll even have this as a potential problem is to estimate what your total income for the year will be. After you've done that, you'll want to estimate your taxable income, which is really easy. If you will be filing a single return, just subtract 2025's standard deduction of $15,000 from your total projected income. If you will file a joint return, subtract the standard deduction of $30,000 from your combined income.
Have your number? See how your taxable income fits within the following ordinary income tax brackets for single and joint filers:
| Entry Level Taxable Income for U.S. Ordinary Income Tax Brackets | ||
|---|---|---|
| Income Tax Bracket (Tax Rate) | Single Filer Taxable Income Needed to Enter Bracket | Joint Filer Taxable Income Needed to Enter Bracket |
| 10% | $0 | $0 |
| 12% | $21,926 | $23,851 |
| 22% | $48,476 | $96,951 |
| 24% | $103,351 | $206,701 |
| 32% | $197,301 | $394,601 |
| 35% | $250,526 | $501,051 |
| 37% | $626,351 | $751,601 |
The thing you're looking for is whether your taxable income is above the entry level taxable income for a given tax bracket. If it is, all income you earn will above that number will be taxed at a higher rate. Unless you act to reduce your taxable income to put it into the next lower tax bracket.
Charles Schwab's Hayden Adams has some suggestions to do that, using a hypothetical taxpaying scenario:
Let's say Ben, a single filer, is on track to make $242,000 in 2025. After factoring in the $15,000 standard deduction and a $19,360 contribution to a pre-tax 401(k), Ben's taxable ordinary income is $207,640 for the year ($242,000 minus $19,360 minus $15,000). At that level of income, $10,340 of taxable income would fall into the 32% ordinary income tax bracket (which kicks in after $197,300 of income). Here are some ways Ben could reduce his income:
- Boost 401(k) contribution. The limit for 2025 is $23,500 for those under 50, so Ben contribute an additional $4,140 his 401(k). Plus…
- Maximize contributions to an HSA. The limit for 2025 is $4,300, so making the max contribution would reduce Ben's income even further (assuming he is eligible). Plus…
- Tax loss harvesting. Up to $3,000 of net capital losses can be used to offset ordinary income, so if Ben harvesting at least $1,900 in losses he would wipe out the income that falls into the 32% tax bracket.
"401(k)" refers to the popular retirement investment account many Americans have available through their employers, in which they set aside a "pre-tax" percentage of their income. "HSA" is a reference to a tax-exempt Health Savings Account that you would most likely also have through your employer.
Tax loss harvesting however is a whole different thing. It requires you to have investments outside of your 401(k) or HSA accounts. And if the name of the concept doesn't give it away, it requires you to lose money on at least part of your investments in that account to claim as losses on your income tax return to offset your taxable income.
Finally, Adams' hypothetical taxpayer is pretty well to do, but engaging in this kind of lawful taxable income management can pay off for people with much lower incomes. If Ben's projected taxable income for 2025 were just above the $48,476 threshold for the 22% threshold, then Ben would have a very powerful incentive to reduce his taxable income. The jump in tax rate from the 12% bracket to the 22% bracket is the largest in the tax tables, so if Ben's taxable income is within striking distance of $48,476 for the options available to him, anything he can do to reduce his taxable income below that level would be very beneficial in avoiding Uncle Sam taking too big a bite out of the income he earns.
Image Credit: Microsoft Copilot Designer. Prompt: "An editorial cartoon of a taxpayer trying to prevent Uncle Sam from taking too much of their income". Which we followed up with "Make it more colorful".
Labels: ideas, income, personal finance, taxes
U.S. Income Tax Day arrives on April 15 in 2025. And since you've probably been racing to complete your 2024 federal income tax returns, what better way could there be to celebrate the most dreaded day on the American calendar than by filling out yet another income tax form?
Before you start pounding the back button or swiping left, there's nothing for you to worry about! You won't have to pay any more income taxes than what you already have reported on whichever version of IRS Form 1040 you're filing this year. Instead, we've built the following tool to transport you in time back to 1913, where our tool will estimate how much your federal income taxes would be if that year's income tax rules still applied.
Why 1913? That's the year the Internal Revenue Service first issued its infamous Form 1040. We've modeled our tool after the first page of the original Form 1040, which back then, consisted of just four pages:
- The summary sheet modeled below (Page 1),
- the Gross Income calculation sheet (Page 2),
- the General Deductions sheet (Page 3), and finally,
- one page of Instructions (Page 4).
Yes, you read that right. Paying U.S. income taxes used to only require one page of instructions!
We'll make it even easier. All you need to do is to enter the indicated data (shown in boldface type, in the rows with a white background), using your figures from this year that should still be very fresh in your memory, and we'll take care of the math! The tool will display its calculated results in the rows with a gray background, where you won't have to worry about entering any values.
If you are accessing this article on a site that republishes our RSS news feed, please click here to access a working version of the tool on our site. Now, if you're ready, let's get to it!...
Here are several excerpts from the instructions for filling out the original IRS Form 1040, which explain some of the math our tool is doing.
Excerpts from the Instructions
3. The normal tax of 1 per cent shall be assessed on the total net income less the specific exemption of $3,000 or $4,000 as the case may be. (For the year 1913, the specific exemption allowable is $2,500, or $3,333.33, as the case may be.) If, however, the normal tax has been deducted and withheld on any part of the income at the source, or if any part of the income is received as dividends upon the stock or from the net earnings of any corporation, etc., which is taxable upon its net income, such income shall be deducted from the individual's total net income for the purpose of calculating the amount of income on which the individual is liable for the normal tax of 1 per cent by virtue of this return.
19. An unmarried individual or a married individual not living with wife or husband shall be allowed an exemption of $3,000. When husband and wife live together they shall be allowed jointly a total exemption of only $4,000 on their aggregate income. They may make a joint return, both subscribing thereto, or if they have separate incomes, they may make separate returns; but in no case shall they jointly claim more than $4,000 exemption on their aggregate income.
Previously on Political Calculations
Haven't had enough taxes yet? Here's a couple of other tools that might be of interest to you!
Image credit: Stable Diffusion DreamStudio Beta: "A greedy Uncle Sam wants to make Americans pay taxes".
Welcome to the blogosphere's toolchest! Here, unlike other blogs dedicated to analyzing current events, we create easy-to-use, simple tools to do the math related to them so you can get in on the action too! If you would like to learn more about these tools, or if you would like to contribute ideas to develop for this blog, please e-mail us at:
ironman at politicalcalculations
Thanks in advance!
Closing values for previous trading day.
This site is primarily powered by:

CSS Validation

RSS Site Feed

JavaScript
The tools on this site are built using JavaScript. If you would like to learn more, one of the best free resources on the web is available at W3Schools.com.
Other Cool Resources
Blog Roll


