In case anyone is looking for us, we're tending to some much needed behind the scenes work here at Political Calculations this week!
See you on January 2, 2007!
 Welcome to the December 22, 2006 year-end edition of On the Moneyed Midways, the blogosphere's only weekly review of the best business, management and money-related posts from each of the week's major blog carnivals! Each week, we select not only the best posts from each of the blog carnivals we read, but we also select one post as being The Best Post of the Week, Anywhere!(TM) But that's not all! We also recognize the close contenders for the best post of the week that was, which you'll find identified below as Absolutely essential reading!(TM)
If you remember last week, we shared some thoughts about machine-made blog carnivals, singling out the work (or lack thereof) of Bryan C. Fleming.
Well, he's been busted again! And this time, by none other than the Silicon Valley Blogger of The Digerati Life, the unwitting victim of Bryan C. Fleming's previous automated blog carnival producing machine-garbled communication.
Last week, we thought that the revealing of Bryan C. Fleming's non-editing carnival editorship was priceless. This week, thanks to the Silicon Valley Blogger, it's even better! And now, on to the rest of the week that was....
| On the Moneyed Midways for December 22, 2006 | |||
|---|---|---|---|
| Carnival | Post | Blog | Comments |
| Carnival of Entrepreneurs | Ten Things That Are Different Now That I'm Self-Employed | J. Timothy King | Absolutely essential reading! J. Timothy King takes a humorous and insightful look at what being your own boss really means! |
| Carnival of Fraud | Want to Be an Investor? | Sacramento Real Estate Voice | Gena's story of a fraudster's serial real estate investing frauds makes for good reading and provides invaluable lessons for potential investors. |
| Carnival of Personal Finance | Subtle (and not so subtle) Rate Increases | InsureBlog | There's a lot afoot in the hidden world of fees and rate hikes in the insurance racket. Bob Vineyard reveals what's up. |
| Carnival of Real Estate | Podcasting and Other Hearing Impaired Issues in the Real Estate Industry | Derek Burress | Derek Buress is hearing impaired and a realtor. Here, he weighs in on the limitations of modern technology coming into use by many realtors in marketing properties. |
| Carnival of Taxes | A Little Christmas Present from Uncle Same and the 109th Congress | Debt Free | Are you looking forward to doing your taxes next year? If not, the nuggets in just passed tax legislation might make your tax-paying experience a better one. |
| Carnival of the Capitalists | Hedge Funds, Politicians and Insider Trading | SOX First | Leon Gettler delivers The Best Post of the Week, Anywhere in his analysis of the machinations behind modern regulation. |
| Cavalcade of Risk | Credit and Identity in Shreds | Widsom from Wenchypoo's Mental Wastebasket | Wenchypoo shreds misperceptions in the world of credit cards and identity theft. |
| Economics and Social Policy | Women's Workforce Participation in 7-year Drop: The Economic Impact | BizzyBlog | Percentagewise, the number of women working has been dropping. Tom Blumer finds that may not be a bad thing! |
| Festival of Frugality | Research - Future Phone Gives Free International Calls! | FIREFinance | If you're going to be making international calls this holiday season, FIREFinance's tip may save you a *lot* of money! |
| Festival of Investing* | Satan's Portfolio - Paying Dividends Since Q1'06 | Long or Short Capital | So, how are ol' Beelz' investments doing at the end of this year? Absolutely essential reading! |
| Festival of Stocks | Pfizer Price Check | Fat Pitch Financials | George takes a very close look at troubled pharmaceutical giant Pfizer and finds reasons to buy its shares. |
| Personal Development Carnival | Success is Personal | Worldwide Success | The global business traveler launches into a reflective post on the nature of what success means. |
| Personal Growth Carnival* | Increasing Your Hourly rate in Order to Get Rich | Paul's Tips | In the most widely posted carnival contribution of the week (at least half a dozen!), Paul argues that you need to work smarter and not harder or longer. |
| Real Estate Investing | Commercial Real Estate: How You Win Even If You Lose | Investment Property Insider | Craig Higdon shows how an investor might come out ahead even when selling their property for a substantial loss. |
| Wealth Building World* | Effective eBay Listing | Wide Bread | Lynn Cognito has a seven point checklist of what you need to make your eBay listings more effective. |
* A "Bryan C. Fleming" production. For more about the Bryan C. Fleming universe of blog carnivals, see this excellent post by the Silicon Valley Blogger at The Digerati Life (or our commentary from the December 15, 2006 edition of On the Moneyed Midways.
Previous Editions
- On the Moneyed Midways – December 22, 2006
- On the Moneyed Midways – December 15, 2006
- On the Moneyed Midways – December 9, 2006
- On the Moneyed Midways – December 2, 2006
- On the Moneyed Midways – November 24, 2006
- On the Moneyed Midways – November 17, 2006
- On the Moneyed Midways – November 11, 2006
- On the Moneyed Midways – November 3, 2006
- On the Moneyed Midways – October 27, 2006
- On the Moneyed Midways – October 21, 2006
- On the Moneyed Midways – October 13, 2006
- On the Moneyed Midways – October 6, 2006
- On the Moneyed Midways – September 30, 2006
- On the Moneyed Midways – September 23, 2006
- On the Moneyed Midways – September 15, 2006
- On the Moneyed Midways – September 8, 2006
- On the Moneyed Midways – September 1, 2006
- On the Moneyed Midways – August 25, 2006
- On the Moneyed Midways – August 19, 2006
- On the Moneyed Midways – August 11, 2006
- On the Moneyed Midways – August 4, 2006
- On the Moneyed Midways – July 29, 2006
- On the Moneyed Midways – July 21, 2006
- On the Moneyed Midways – July 14, 2006
- On the Moneyed Midways – July 7, 2006
- On the Moneyed Midways – June 30, 2006
- On the Moneyed Midways – June 23, 2006
- On the Moneyed Midways – June 16, 2006
- On the Moneyed Midways – June 9, 2006
- On the Moneyed Midways – June 2, 2006
- On the Moneyed Midways – May 26, 2006
- On the Moneyed Midways – May 19, 2006
- On the Moneyed Midways – May 12, 2006
- On the Moneyed Midways – May 5, 2006
- On the Moneyed Midways – April 28, 2006
- On the Moneyed Midways – April 21, 2006
- On the Moneyed Midways – April 14, 2006
- On the Moneyed Midways – April 7, 2006
- On the Moneyed Midways – March 31, 2006
- On the Moneyed Midways – March 24, 2006
- On the Moneyed Midways – March 31, 2006
- On the Moneyed Midways – St. Patrick's Day 2006 Edition
- On the Moneyed Midways – March 10, 2006
- On the Moneyed Midways - The inaugural edition from March 3, 2006!
 With the BEA's finalization of the 2006 third quarter GDP figures last Thursday (available here as a 136KB PDF document), we thought it would be a good time to pull out our backward-looking crystal ball to forecast the future direction of the U.S. economy.
We, and you, can accomplish this task by taking advantage of our "Climbing Limo" GDP forecasting tool, which was inspired by The Skeptical Optimist. The method allows you to predict the level of GDP some three quarters into the future. All you need is the most recent history of GDP data, and maybe a wizard hat, and you're now just as qualified as any professionally-trained pundit to predict where the U.S. economy is going, and maybe even more so!
The following chart shows what we found after incorporating the latest data and, for good measure, shows the actual and forecast values of inflation-adjusted GDP going back to the second quarter of 2005, some two years before the latest quarter for which we've forecast data. The heavy green line represents the recorded inflation-adjusted (or real) GDP results, while the dashed purple line shows the level forecast by the "Climbing Limo" method:

If we assume that the "Climbing Limo" method produces good forecasts of future GDP levels, it would seem that the second quarter of 2007 will be pretty rocky following pretty good GDP growth in the current fourth quarter of 2006 and the first quarter of 2007. If we also assume that the sentiment of investors is motivated by such backward-looking generated economic forecasts (or is just informed by their recent experience), we would anticipate that the first quarter of 2007 will see a significant decline in the stock market, as they factor these expectations of lower future economic activity into their forward-looking investment decisions.
See? Anybody can do this! Maybe we should try our hands at astrology!
It's another one of those days when all those nagging thoughts that pop into our heads for no apparent reason couldn't keep themselves contained....
We've been wondering lately about Tyler Cowen and Alex Tabarrok, the co-authors of Marginal Revolution. Specifically, just which one is the "marginal" half of the revolution? Which do you think the other would point to? And what if you asked them together?
Even worse, could they have something to do with the Margarine Revolution?
This whole thing about the trade deficit leading to national debt... we're not exactly sure how that happens. Correct us if we're wrong, but when the people who import stuff from China, Japan, Europe and Botswana into the US get around to selling it, don't they do it for a lot more money than they paid for it?
Glenn Reynolds quotes Groucho Marx today. Here our a few of our favorite Marxist principles:
Politics is the art of looking for trouble, finding it everywhere, diagnosing it incorrectly and applying the wrong remedies.
I worked my way up from nothing to a state of extreme poverty.
A black cat crossing your path signifies that the animal is going somewhere.
And finally, because it's so appropriate when discussing Marxist principles:
Those are my principles, and if you don't like them... well, I have others.
We've been intrigued by the concept of fundamental-weighted indexing since we first encountered it over a year ago. In a nutshell, a fundamental index will take measures such as revenues, cash flow, dividends, or other business performance data for a large number of publicly-traded companies and use them to decide how much of each stock of each company to include within the index. This method of weighting the components of a stock market index contrasts with the more common technique of weighting them within an index according to their relative market capitalization, as is done with major market indices like the S&P 500.
A recent article in Fortune magazine provides a really good rundown of the basics between the two:
The virtues of index investing are well known: low turnover, low cost, and you are sure to keep pace with the market. But there's one potential problem: The S&P 500 and other popular indexes are capitalization-weighted: Companies are represented based on their market value (share price times number of shares outstanding), so as stocks run up, so does their presence in the index. As a result, during times of market exuberance highflying stocks account for a disproportionate share of the index. The prime example came in the late 1990s. People who put money into an S&P 500 index fund in those years were getting a huge helping of wildly overvalued tech shares. They paid the price when the bubble burst.
To address that problem, Rob Arnott, chairman of Research Affiliates, an asset-management firm, set out to develop indexes that aren't linked to stock valuation. After testing various formulas using decades of U.S. and foreign stock market data, he found that indexes that weight companies based on a combination of sales, cash flow, book value, and dividends would almost always outperform traditional ones. His RAFI U.S. 1000, for example, would have earned an annualized average of 12.35% from 1962 through 2005, vs. 10.25% for the S&P 500; that means a hypothetical $1,000 invested in the RAFI index would have grown to $186,000, compared with $73,000 if invested in the S&P 500.
Since today marks the one-year anniversary of the launching of the PowerShares RAFI 1000 Exchange Traded Fund (Ticker: PRF), we thought we'd compare the performance of this ETF against the S&P 500:
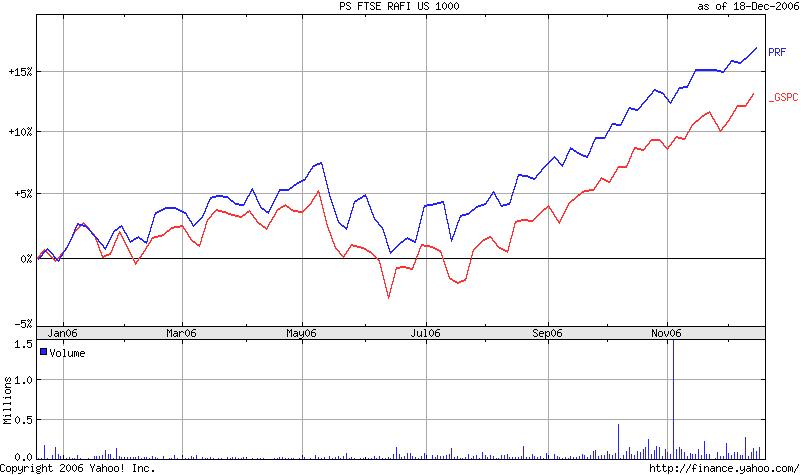
After adjusting for dividends, the annualized rate of return for an investment in the fundamental-weighted PRF is 17.23% (based on it's December 20, 2005 closing value of 49.46 per share and today's closing value of 57.98.) This compares very favorably to the market cap-weighted S&P 500 annualized rate of return of 13.17%, which closed today at 1425.55, up from 1259.62 a year ago. In all, the fundamental-weighted index outperformed the S&P 500 by 4.05%.
The Fortune article notes the difference between the expenses and turnover rates of the PRF ETF compared to the iShares Russell 1000 Value Index (Ticker: IWD):
The PowerShares RAFI 1000 fund, for example, has annual expenses of 0.6%, vs. 0.2% for the cap-weighted iShares Russell 1000 Value Index and annual turnover of 10%, vs. 7% for the iShares fund. Those differences are small, and to Arnott they're justified. "If price goes up and the fundamental scale of a company hasn't, we're going to be trimming it," he says. "And to my way of thinking that's good turnover. Why should we own twice as much [of a stock] just because the price has doubled?"
Here's a chart comparing the one-year performance of these two ETFs:

We see that right now, the iShares Russell 1000 Value Index is outperforming the PRF ETF, with an annualized rate of return of 21.38% compared to 17.23% - a 4.16% advantage (and an 8.21% advantage over the S&P 500.) We'll also note that these two investments do seem to track each other fairly closely, with one seeming to catch up to the other over time, indicating that more time would be required to tell which stock weighting method consistently outperforms the other, although the Russell 1000 Value Index does have an inherent cost advantage.
We'll close with one more quote from the Fortune article, which identifies why the fundamental-weighted indices would seem to outperform their market-capitalization weighted competition:
The secret seems to be simply that these fundamental indexes reduce the presence of overvalued stocks - the kind most susceptible to steep declines. Overall, the average P/E of stocks in the Russell 1000 is 17, compared with 15 for Arnott's RAFI U.S. 1000.
Since the Russell 1000 (Ticker: RUI) is different from the Russell 1000 Value Index, here's one more chart comparing the performance of the PRF ETF with the Russell 1000 index:
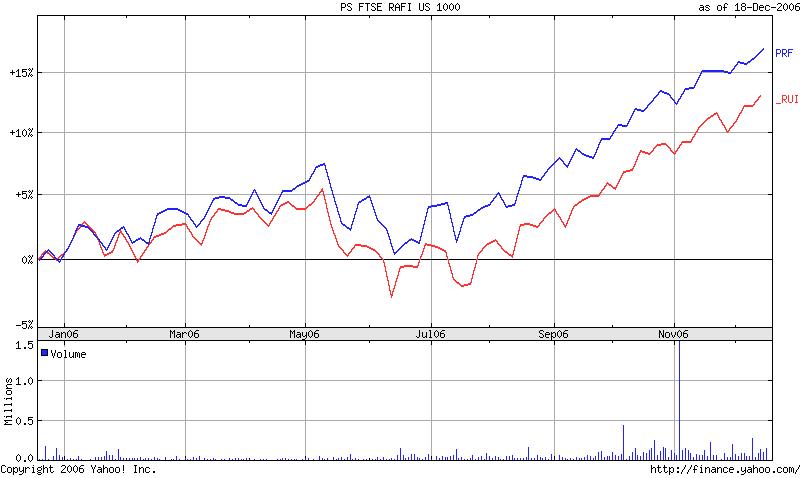
The Russell 1000 Index appears to slightly underperform the S&P 500 - its one year rate of return is 13.02%, just 0.15% below the return of the S&P 500. It would seem that the fundamental-weighted index so far outperforms the market capitalization weighted general stock market indices, justifying its higher expenses and turnover for this case, but perhaps not a market-cap weighted index of value stocks. More time, and perhaps historical backtesting, might be able to clarify which method is better over the long run.
Previously on Political Calculations
Images will be fixed soon are fixed!...
 Not long ago, we posted a tool that can help you figure out how much time you could chop off the length of your loan if you increased the amount of your regular payment. The tool itself is pretty simple - it takes some basic information about your loan and the new amount of your payment, then figures out the time savings.
But, what if you wanted to figure out how much you needed to increase your payment to retire your loan early by a certain period of time? For instance, if you had a four year car loan with monthly payments and you wanted to shave a year off of that, how much would you need to pay each month?
You could play the hit-or-miss trial and error game with our original tool, but we have something better for you! Our newest tool finds out what your regular payment has to be to pay your loan off early given how much time you want to save! Just enter your data into our tool below and we'll do the heavy math for you:
Assuming that you don't have any pre-payment penalties, paying your loan off early might make a lot of sense (or a lot of "cents" if you're a fan of really bad puns.) The only question left is whether doing so makes sense for you!
Labels: debt management, tool
Welcome to the December 15, 2006 weekend edition of On the Moneyed Midways, the blogosphere's only weekly review of the best business, management and money-related posts from each of the week's major blog carnivals! Each week, we select not only the best posts from each of the blog carnivals we read, but we also select one post as being The Best Post of the Week, Anywhere!(TM) But that's not all! We also recognize the close contenders for the best post of the week that was, which you'll find identified below as Absolutely essential reading!(TM)
If you're anxious to get reading this week's edition, go ahead and scroll on down since this section is a quick "how not to run a blog carnival" editorial.
For those of you who are regular readers, or perhaps contributors to blog carnivals, odds are that you're familiar with the work of one-man-blogging-carnival-industry ringmaster, Bryan C. Fleming. Bryan's niche in the world of blog carnivals is to generate web traffic for several web sites he operates. Now, there's nothing wrong with that and normally, he does a pretty decent, but not stellar, job for the carnivals he assembles. After all, putting together a blog carnival does take a bit of work, and many of us who take on the job on a regular basis will develop or rely on systems that have been set up to automate a good part of the process, which Bryan clearly does.
This week though, things were clearly on autopilot in the Bryan C. Fleming universe of blog carnivals, as this week's Festival of Investing featured these contributions (from a truly good blogger whose work we've previously featured, and who probably thought there might be a real-life person organizing the carnival somewhere in that alternate universe):
Silicon Valley Blogger presents A First Look At Asset Allocation posted at The Digerati Life.
Silicon Valley Blogger presents A First Look At Asset Allocation posted at The Digerati Life, saying, “My apologies for the double submission — I had entered the wrong email address and wasn’t sure if my post would make it to your carnival so I resubmitted. I am sorry for the inconvenience and hope you will consider my post. Thank you very much! - SVB”
Priceless. And now, onto the best posts of the week that was....
| On the Moneyed Midways for December 15, 2006 | |||
|---|---|---|---|
| Carnival | Post | Blog | Comments |
| Carnival of Entrepreneurs | Trust Tip 7: Returning Calls Unbelievably Fast | Trusted Advisor | Being there, as in quickly returning customer calls (or organizing blog carnivals!), really matters in building trust according to Charles H. Green. |
| Carnival of Fraud | Is DELL Cooking the Books? | Stock Market Beat | Accounting always sounds boring until potential fraud turns up! William Trent takes a closer look at how Dell is really dealing with its warranty expenses. |
| Carnival of Investing | Investment Risk Tolerance: What's Yours? | Personal Finance Advice | Are you ready to take a quiz? Are you ready to take five quizzes? Jeffrey Strain challenges you to find out what your true tolerance for risk might be! |
| Carnival of Personal Finance | Baseball Cards Can Teach Your Kids About Stocks | Finance-4-Kids | Ever wonder how to drive home lessons about investing for kids? Finance-4-Kids finds baseball cards might be a good place to start. |
| Carnival of Real Estate | The Six Stages of the Long-Term Real Estate Play | Active Rain | Brian Brady identifies the stages that the hottest ex-urbs go through on their way from hidden value to realized investment returns. |
| Carnival of the Capitalists | How to Layoff 2,000 People | Passion, People and Principles | If you have no choice but to layoff 2,000 people, how would you do it? David Maister argues its best to do so quickly since it makes the effects less personal. Also see Charles Green's "Pfizer, Doctors, Sales and Trust". |
| Economics and Social Policy | Pfizer, Doctors, Sales and Trust | Trusted Advisor | Charles H. Green's post served as the starting point for David Maister's "How to Lay Off 2,000 People" post elsewhere in this week's edition of OMM. Absolutely essential reading! |
| Festival of Stocks | Investing in the Growing Dental Industry | BioHealth Investor | Did you know that dentistry is booming? H.S. Ayoub, DMD, examines investment opportunities in the world of dental care. |
| Home Business Carnival | How to Perform a Professional Analysis of Your Competition | Buzzle | Jim Hart talks through a three prong strategy for analyzing your competition. Absolutely essential reading! |
| Personal Development Carnival | Your Business Blogger at Stern School of Business | Reasoned Audacity | Jack Yoest shares the Cliff Notes version of what he lectured about to a group of budding entrepreneurs at NYU. |
| Personal Development Carnival | Serious Tips to Help You Get Over Your Ex | Levnnow Self-Help Tools | Is there someone in your life for whom you've needed to sever all contact because it's not good for you? Tabs offers advice on how to move on successfully. |
| Personal Growth Carnival | They've Brainwashed Us | GameProducer.net | Juuso notes that while it's easy to question everybody else, it's a heck of a lot of work to question yourself. If you're going to ask yourself some tough questions, it might help to acknowledge that you've been brainwashed. |
| Real Estate Investing | The Most Effective Tool an Investor Can Use! | Cash Flow Treasures | If you're a real estate investor, Steve Burns has identified the best tool for you to use in researching your opportunities: the Recorder's Office! |
| Wealth Building Ideas | There Is a Science to Get Rich | Emmanuel Oluwatosin: Inspiring Excellence, Realising Ambitions | Why does it seem like like things are only working for some people, while others are left far behind? Emmanuel Oluwatosin answers the question in The Best Post of the Week, Anywhere! |
| Working at Home | Are You Really Helping? | Success from the Nest | Lots of people assume they know what their customers want, but Tony Clark says that may not be so true. Absolutely essential reading! |
Just for the record, the members of Bryan C. Fleming's universe of blog carnivals include:
- Festival of Investing (hosted at Investing World Today)
- Personal Growth Carnival (hosted at Bryan C. Fleming)
- Wealth Building Ideas (hosted at Wealth Building World)
Previous Editions
- On the Moneyed Midways – December 15, 2006
- On the Moneyed Midways – December 9, 2006
- On the Moneyed Midways – December 1, 2006
- On the Moneyed Midways – November 24, 2006
- On the Moneyed Midways – November 17, 2006
- On the Moneyed Midways – November 11, 2006
- On the Moneyed Midways – November 3, 2006
- On the Moneyed Midways – October 27, 2006
- On the Moneyed Midways – October 21, 2006
- On the Moneyed Midways – October 13, 2006
- On the Moneyed Midways – October 6, 2006
- On the Moneyed Midways – September 30, 2006
- On the Moneyed Midways – September 23, 2006
- On the Moneyed Midways – September 15, 2006
- On the Moneyed Midways – September 8, 2006
- On the Moneyed Midways – September 1, 2006
- On the Moneyed Midways – August 25, 2006
- On the Moneyed Midways – August 19, 2006
- On the Moneyed Midways – August 11, 2006
- On the Moneyed Midways – August 4, 2006
- On the Moneyed Midways – July 29, 2006
- On the Moneyed Midways – July 21, 2006
- On the Moneyed Midways – July 14, 2006
- On the Moneyed Midways – July 7, 2006
- On the Moneyed Midways – June 30, 2006
- On the Moneyed Midways – June 23, 2006
- On the Moneyed Midways – June 16, 2006
- On the Moneyed Midways – June 9, 2006
- On the Moneyed Midways – June 2, 2006
- On the Moneyed Midways – May 26, 2006
- On the Moneyed Midways – May 19, 2006
- On the Moneyed Midways – May 12, 2006
- On the Moneyed Midways – May 5, 2006
- On the Moneyed Midways – April 28, 2006
- On the Moneyed Midways – April 21, 2006
- On the Moneyed Midways – April 14, 2006
- On the Moneyed Midways – April 7, 2006
- On the Moneyed Midways – March 31, 2006
- On the Moneyed Midways – March 24, 2006
- On the Moneyed Midways – March 31, 2006
- On the Moneyed Midways – St. Patrick's Day 2006 Edition
- On the Moneyed Midways – March 10, 2006
- On the Moneyed Midways - The inaugural edition from March 3, 2006!
 At some point during your working life, you will be in an office. Whether you work there, or are just passing through, it's important that you remember some of these basic skills to avoid the potential embarrassment, or even career derailment, that might otherwise result.
We here at Political Calculations care about your career, so we've put together an erratic series of tips to help you overcome some of the more common embarrassing situations you might encounter in the office. As many office grunts already know, the modern office is fraught with danger, so heed our warnings and you just might survive until retirement.
Today's tip focuses on one of the most potentially embarrassing things that can possibly happen to you in an office: using a permanent marker on a dry-erase board. Sure, they write a lot better on them than the dry-erase markers do, but when you have to erase them, you're in for a nasty surprise as whatever you've written takes on the hint of dry-erase board immortality as all the scrubbing you're doing with that little dry-erase board eraser proves futile.
 So what's the modern desk slave to do after committing what may be the most common act of office vandalism in front of witnesses? That's where your office ju-jitsu skills come into play! Tell your stunned audience to "Watch this!" Then, calmly pick up a dry erase marker (the one you *should* have used) and scribble over a portion of what you've written.
The same chemicals inside of the common dry-erase marker that make them much less effective at writing on a dry-erase board than a permanent marker will now act to dissolve the ink left behind by the permanent marker! Even more miraculously, that seemingly useless and hopelessly small dry-erase board eraser will now literally wipe the board clean as if it were designed to do just that, as opposed to occupy space in the dry-erase board marker tray!
It's that easy! So go ahead and use that permanent marker proudly on the executive office suite's main conference room - you know you've always wanted to! Now's your chance while all the brass is watching, because now you know how to get out of what could turned into a really bad performance evaluation.
Today's non-action by the Federal Reserve in leaving the Federal Funds Rate unchanged at 5.25% was pretty much what Fed watchers have been expecting. What they may not have been expecting, especially compared to recent weeks, is that the probability of recession beginning sometime in 2007 has essentially leveled off at 46.4%, based upon today's closing 10-year Treasury yield of 4.48% and a 3-month Treasury yield of 4.79%.
What's happened to produce this effect? Well, if we were to point to one single event, it would be Paul Krugman's December 1 column (HT: Mark Thoma, who's excerpted much of what's hidden behind the New York Times' TimesSelect) that a recession in 2007 would be likely! Given Krugman's dismal record as an economic forecaster (HT: Will Franklin), we believe this single column all but ensured that the U.S. economy in 2007 would be recession free! (In case anyone wondered why we were so excited that Professor Krugman visited us back on December 1, we hope this explains why!)
More seriously, what has happened is the that the yield of the 3-month Treasury began a significant decline at the end of November. The trend is easily seen in the Constant Maturity Treasury yield curve data (Note: we point to the secondary market yield data on our tool since it so far seems to fairly represent the one-quarter average of constant maturity treasury yield data that the recession probability method developed by Jonathan Wright uses. So far, we haven't found the averaged data posted conveniently anywhere online.) Here, the 3-month Treasury dropped from a high closing daily value of 5.27% on November 27, to a value of 5.22% on December 1 when Krugman's column appeared, then on down to 4.87% today, all while the 10-year Treasury yield has remained essentially flat around 4.50%.
This action has flattened out the yield curve after having become increasingly inverted in recent weeks, perhaps driven by an assessment by bond traders that a 2007 recession would be unlikely. Perhaps again driven by their assessment of Paul Krugman's skill as an economic prognosticator. (Have we given the good professor enough trouble yet?)
In any case, our visualization of the probability of recession occurring in the next 12 months shows the snapshot of where we are today:

The next meeting of the Fed's Open Market Committee is set for January 30-31. Since the current expectations would suggest that they'll be cutting interest rates, we're looking forward to the potential for real action the next time around!
Somehow, somewhere, Edward Prescott lost two macroeconomic myths between today's column in the Wall Street Journal (excerpted here via Mark Thoma) and a recent presentation he made back in October to the Economic Club of Phoenix. We here at Political Calculations thought it might be interesting to see what got clipped from the Nobel prize winner's previous mythbusting list!
First, here's Tyler Cowen's thumbnail summary of the five that were included in today's WSJ:
Myth No. 1: Monetary policy causes booms and busts.
Myth No. 2: GDP growth was extraordinary in the 1990s.
Myth No. 3: Americans don't save.
Myth No. 4: The U.S. government debt is big.
Myth No. 5: Government debt is a burden on our grandchildren.
And now, drum roll please, from the mess of scraps we found cluttering the floor of the Wall Street Journal, here are the missing two myths:
Myth No. 6 (originally Myth No. 3): The 1978-82 recession was caused by tight monetary policy. Here's what Prescott had to say about this particular myth (From the WP Carey business school's record of Prescott's Phoenix presentation):
"Everybody says that former Fed Chairman Paul Volcker caused the 1978-82 recession with his tight money (high real Federal Funds rate) policies," suggested Prescott. But looking at the data historically, there is no consistent relationship between monetary policy and real economic activity.
"Between 1975 and 1980 monetary policy was very loose (the real Federal Funds rate was low)," Prescott said. At the same time, output trended upward until 1979, when it began a downward trend.
Yet even though output began a downward trend in 1979, the Fed didn't significantly tighten monetary policy until 1981. Then, output continued its downward trend through 1982, when it began to climb again -- even though monetary policy was still tight.
In the end, Prescott says, he doesn't see any relationship between the real economic activity and monetary policy during the 1975-85 period.
And now, the one, the only, and the original Myth No. 7: U.S. economy is doing much better than the European economy! Here's what Prescott had to say about that (again from the Phoenix presentation):
It's true, Prescott said, that the labor supply is depressed in Europe. "They have a problem and they understand that." But Europe's problems, Prescott suggests, are policy related. "Europe is as productive as the U.S.," Prescott said. "It's just that their tax rates are too high and as a result they work too little." Germany, France and Italy will follow the lead of the United Kingdom and Spain and cut their tax rates. This will result in these countries catching up to the United States in terms of GDP per capita.
Like Europe, per capita GDP in the U.S. has been roughly on trend since 1991, with the exception of the boom in the late 1990s.
In Japan, in contrast, productivity stopped between 1992 and 2002. Prescott conjectures that this occurred because Japan's bureaucratic industrial banking complex subsidized inefficient businesses in this period. "A firm will not make a needed investment to become more efficient if its competitors are subsidized. Because of the subsidies to competitors, there is not a return on this investment. The incentives are perverse," Prescott said.
Don't make us do this again, Wall Street Journal! We like *all* our macroeconomic myths to get busted (preferably by professionals.) And scrub your floors while you're at it!
Welcome to the December 9, 2006 weekend edition of On the Moneyed Midways, the blogosphere's only weekly review of the best business, management and money-related posts from each of the week's major blog carnivals! Each week, we select not only the best posts from each of the blog carnivals we read, but we also select one post as being The Best Post of the Week, Anywhere!(TM)
In addition to The Best Post of the Week, Anywhere!, we've also identified posts that you can't miss reading - what we believe to be Absolutely essential reading!(TM) You'll find them all below - just scroll down for the best posts of the week that was....
| On the Moneyed Midways for December 09, 2006 | |||
|---|---|---|---|
| Carnival | Post | Blog | Comments |
| Carnival of Career Intensity | The One Skill You'd Better Look For | Water Cooler Wisdom | Employers look for a lot of skills or specific types of experience, but Andrea Levit argues they should be really seeking the ability to learn. |
| Carnival of Debt Reduction | The Debt Mindset | Debt Consolidation | Are the people around you a bad influence where debt is concerned? Mark Shead lists seven traits for which to watch out. Absolutely essential reading. |
| Carnival of Fraud | How to Buy a PlayStation 3 for $0.99 | The Digerati Life | "Don’t try this at home or anywhere," the Silicon Valley Blogger advises, because "you WILL get into trouble." |
| Carnival of Investing | Where to Get Financial Data | The Dividend Guy Blog | The Dividend Guy lists good sites to get data for doing due diligence when making investment decisions. |
| Carnival of Marketing | The Big Google Adwords Experiment | The Get Known Now Blog | Suzanne Falter-Barns failed with Google's Adwords before, but is now trying a new approach in using them to attract customers more effectively. |
| Carnival of Passive Income | The Best Way of Making Money on a Blog is Through Sponsorship | Instigator Blog | Has Ben Yoskovitz decoded the secret to making money that millions of bloggers would like to know? |
| Carnival of Personal Finance | The Young Tightwad's Guide to Holiday Tipping | Money Under 30 | How much to tip at the holidays is always a mine-filled topic, and David of Money Under 30 provides guidance for how much and to who! |
| Carnival of Real Estate | Economics vs. Risk Management: Today's Housing Market | Sadie's Take on Delaware Ohio | You'd think that as buyer incentives increase that more house sales would follow (as suggested by economics), but the evidence is that they're not. Toby explains how a change in the mindset of buyers for managing their risk has redefined the rules of the day. |
| Carnival of Real Estate Investing | Working with an Out of State Property Manager | TheLandlordBlog | Anesia Springborn discusses the ins and outs of owning rental properties far away from where you live. |
| Carnival of Taxes | How the New Tax Laws for 2007/08 Could Affect You | My Two Dollars | David highlights some of the neater changes in U.S. tax law that actually benefit U.S. taxpayers. |
| Carnival of the Capitalists | Utopia Crashes to Earth | Wisdom from Wenchypoo's Mental Wastebasket | Wenchypoo measures the central economic policy tenets of liberal Democratic Party politics, comparing them to reality, and wonders if they ought to consider their continued existence as a political party. |
| Cavalcade of Risk | The End of Insurance | Worker's Comp Insider | Will today's new datamining technology rewrite who can be insured as the concept of pooling risk becomes a thing of the past? The Best Post of the Week, Anywhere! |
| Economics and Social Policy | Utopia Crashes to Earth | Wisdom from Wenchypoo's Mental Wastebasket | Wenchypoo measures the central economic policy tenets of liberal Democratic Party politics, comparing them to reality, and wonders if they ought to consider their continued existence as a political party. |
| Festival of Frugality | Don't Like Your Gift Cards? Trade Them or Sell Them for Cash | Money, Matter, and More Musings | Talk about markets in everything! Did you know that there's an aftermarket for gift cards where you can buy, sell or trade them? Absolutely essential reading for the holiday season! |
| Festival of Investing | Private Equity Bubble Trouble | SOX First | Leon Gettler finds the buzz surrounding the recent frenzy in private equity may be on its way to reaching dot com bubble proportions. |
| Festival of Stocks | 2 x 2 Matrix: Less & More | Long or Short Capital | We love it when MBA type analytical tools make their way into blog posts, and Mr Juggles doesn't disappoint with his analysis of the media industry! |
| Personal Development Carnival | New Year Preparation - Clean House | Balanced Life Center | Now is the time to begin preparing to start the new year off right, and cleaning out your house, schedule and address book are the places to start. |
| Personal Growth Carnival | How to Use a Sick Day to Change Your Life | A Better You Blog | Patricia outlines the things you can do to make your sick days genuinely productive. |
| Wealth Building Ideas | Insurance Expert Discusses Health Care Crisis. Sort of. | Rdoctor.com | Aleksandr Kavokin interviews health insurance expert Hank Stern, who rejects a lot of conventional wisdom held by many people about it. Absolutely essential reading! |
| Working at Home | What Monks Can Teach You About Healthy Computing | Ririan Project | Ririan shows how your aching neck might be cured by following the example of illuminating monks! |
Previous Editions
- On the Moneyed Midways – December 9, 2006
- On the Moneyed Midways – December 1, 2006
- On the Moneyed Midways – November 24, 2006
- On the Moneyed Midways – November 17, 2006
- On the Moneyed Midways – November 11, 2006
- On the Moneyed Midways – November 3, 2006
- On the Moneyed Midways – October 27, 2006
- On the Moneyed Midways – October 21, 2006
- On the Moneyed Midways – October 13, 2006
- On the Moneyed Midways – October 6, 2006
- On the Moneyed Midways – September 30, 2006
- On the Moneyed Midways – September 23, 2006
- On the Moneyed Midways – September 15, 2006
- On the Moneyed Midways – September 8, 2006
- On the Moneyed Midways – September 1, 2006
- On the Moneyed Midways – August 25, 2006
- On the Moneyed Midways – August 19, 2006
- On the Moneyed Midways – August 11, 2006
- On the Moneyed Midways – August 4, 2006
- On the Moneyed Midways – July 29, 2006
- On the Moneyed Midways – July 21, 2006
- On the Moneyed Midways – July 14, 2006
- On the Moneyed Midways – July 7, 2006
- On the Moneyed Midways – June 30, 2006
- On the Moneyed Midways – June 23, 2006
- On the Moneyed Midways – June 16, 2006
- On the Moneyed Midways – June 9, 2006
- On the Moneyed Midways – June 2, 2006
- On the Moneyed Midways – May 26, 2006
- On the Moneyed Midways – May 19, 2006
- On the Moneyed Midways – May 12, 2006
- On the Moneyed Midways – May 5, 2006
- On the Moneyed Midways – April 28, 2006
- On the Moneyed Midways – April 21, 2006
- On the Moneyed Midways – April 14, 2006
- On the Moneyed Midways – April 7, 2006
- On the Moneyed Midways – March 31, 2006
- On the Moneyed Midways – March 24, 2006
- On the Moneyed Midways – March 31, 2006
- On the Moneyed Midways – St. Patrick's Day 2006 Edition
- On the Moneyed Midways – March 10, 2006
- On the Moneyed Midways - The inaugural edition from March 3, 2006!
We've been celebrating our two-year anniversary this week here at Political Calculations, which only partially accounts for our mad tool-posting spree! On Monday, we translated what Amazon.com's ranks mean in terms of number of books sold. On Tuesday, we posted our tool for figuring out how much time you could chop off your loans if you upped your regular payment.
Then, on Wednesday, we put very nearly the entire history of the S&P 500 at your fingertips - everything from the average index value for each month in the stock market index's history through June 2006 to the inflation-adjusted rate of return between any two dates! Big deal? You bet! Here's how Uncle Jack described it:
How would you like to compare any time span for the market with two clicks and get the answers you need with the third click? Sound too easy? Political Calculations has created the coolest, easiest to use tool, and your one stop free blog shop for S&P 500 data dating all the way back to 1926.
Better ad copy than we could ever write! The only alteration we would make would be to change "1926" to "1871". Surprise!
Yesterday, we took advantage of some of our rare spare time and took on the scourge of malaria! We posted two tools in one post that might help public health officials and private relief efforts better direct and target malaria control efforts in the regions of the world where the condition is endemic. Is it possible that we just did more for the impoverished peoples who must cope with the disease than Jeffrey Sachs and/or Angelina Jolie combined? We'll see....
We really have no idea what we're going to take on from one day to the next around here!
And here we are on Friday, all the stuff we did earlier this week means that we're going to push our regular weekly review of the best business, career, management and money-related blog carnivals off to Saturday, because we could use a day off before going back to our regular routine. See you tomorrow!
 That's the title of Andrew Klein's very interesting article that we came across back in July. What intrigued us most was the lead paragraphs of Klein's article, which outline the promise of research led by the National Institute of Health's David Smith, the results of which were published in the November 24, 2005 edition ($$$) of Nature:
Scientists have created a mathematical formula that could improve malaria treatment by accurately predicting which populations are most vulnerable to the disease, which kills 1.3 million people, mostly children, annually.
The formula could help to focus anti-malarial drugs and preventative treatments on those who need them most by identifying and targeting high-risk groups. This would eliminate the need for blanket treatment of large populations, a process that wastes scarce resources and runs the risk of increasing resistance to anti-malarial drugs.
 This potential improvement in the treatment of malaria is extremely important, since the NIH's researchers determined that 20% of the children studied contracted 80% of all the malarial infections. By focusing on those most likely to be especially vulnerable to infection though mosquito bites, malaria might be much better controlled today and in the future.
The formula considers the relationship between the Parasite Ratio, the proportion of people who are infected with Plasmodium falciparum, the parasite that causes malaria, and the rate at which people are bitten by parasite-carrying mosquitoes (called the Entomological Inoculation Rate.) Compared to previous attempt to model the relationship between these two factors, the new formula closely models observed rates of infection in affected populations. The following figure from Nature illustrates the relationship between the Parasite Ratio (PR) and the Entomological Inoculation Rate (EIR) in the formula (the central curve is defined by the formula):

If you're a regular visitor to Political Calculations, you already know where this is going, as our latest tool does the math put forward by the NIH's researchers! Health researchers and epidemiologists need only to enter the Entomological Inoculation Rate to find the corresponding Parasite Ratio for a given population:
EIR to PR Calculation
The paper published by Smith et al in Nature informs us that the Entomological Inoculation Rate is rarely recorded in Africa, while the Parasite Ratio is a widely measured index of infection risk. Because of these facts, we thought it might also be useful to make a tool to find the Entomological Inoculation Rate given only the Parasite Ratio, which follows below:
PR to EIR Calculation
As a final note, the formula can be used to find the amount of benefit, as measured by a lower Parasite Ratio (PR), that can be achieved by taking steps to reduce the Entomological Inoculation Rate (EIR) for the affected populations:
In quantitative terms, reducing EIR from 200 to 100 and then to 50 would reduce PR by 4% and then by an additional 5%.
 Blanket treatment, as is often the practice in regions afflicted by malaria, would make these benefits prohibitively expensive to achieve. By instead focusing malaria control efforts aimed at reducing the EIR by targeting those most susceptible to infection, scarce resources could be better applied and substantially more lives saved – all through the magic of math!
Update: Reuters reports that malaria may be facilitating the spread of AIDS in sub-Saharan Africa. If the researchers' findings hold up, this report suggests that Emily Oster's proposal for reducing the spread of AIDS in Africa by focusing on other sexually-transmitted diseases might have a more "mainstream" disease to include in the list of conditions to target (one with the benefit of carrying less potential stigma for those who might not seek treatment otherwise).
Labels: health, health care, math, medicine, tool
 Countless hours have been spent by stock market investors researching the historic performance of the S&P 500 stock market index but until now, they've had to slog through spreadsheets or go datamine other reams of data to be able to extract the data they're after, and that's before doing any number crunching! Now however, everything has changed because we here at Political Calculations are putting the entire encapsulated history of the S&P 500 at your fingertips!
We've taken the raw data from the sources linked above, and made it easily accessible by selecting a month and year in our tool below. The tool will provide the average index value of the S&P 500 for the given month and year, the associated dividends and earnings for that month and year, not to mention the dividend yield and the price to earnings ratio. For good measure, we threw in the value of the Consumer Price Index as well!
But wait, that's not all! We did all this for a second date that you might select as well - and then we really get busy! Our tool will find the annualized rate of return for an investment made in the S&P 500 between the two dates you select, both with and without considering the reinvestment of dividends in the index.
And then, there's even more! For no extra charge, we'll also factor in inflation into the calculations and find the rate of inflation between the two dates you select, not to mention the inflation-adjusted rates of return for an investment made in the S&P 500 between the two dates as well!
Better than sliced bread? Maybe not, but we couldn't think of a better way to celebrate our second anniversary today. Enjoy!
Note: The earnings and dividend data in the most recently reported years may be subject to change as the index' component companies may restate portions of their financial data for various reasons.
Who knows? Maybe this tool will end up on EH.NET!
Update 16 July 2009: We now have a tool that you can use to find the inflation-adjusted value of a one-time or series of hypothetical investments in the S&P 500 between any two months since January 1871: Investing Through Time!
Approximate Schedule of Updates
We update our S&P 500 performance tool each month after the Bureau of Labor Statistics releases the previous month's Consumer Price Index for Urban areas, which we use to determine the real rates of return for the S&P 500 through that month. Here is the latest schedule of releases from the BLS.
Update Notes
We periodically update the earnings and dividend data used in the tool presented on this page as this data is revised by Standard & Poor. The log below describes the major revisions we've made to our tool over its history.
- 18 December 2025: The Senate Democrats' government shutdown fiasco blocked consumer price data from being collected for October 2025, while the data for November 2025 was delayed. For October 2025, we've opted to keep Forecast.org's consumer price index projection from early October 2025 as a reasonable estimate of inflation for this month. The BLS' official CPI series resumes with the CPI for November 2025.
- 4 April 2022: S&P hasn't yet reported the quarterly dividend figure for 2022-Q1 in any of the usual places (at this writing), so we're going forward with an estimate that is subject to revision. We'll update this note when it has either been confirmed or revised. Update 9 April 2022: We've confirmed the estimate!
- 2 April 2020: We're experimenting with implementing updates shortly after month end using the Financial Forecast Center's monthly forecast for the Consumer Price Index, which we'll supersede with the official figure from the Bureau of Labor Statistics later in the month after it is released. The change only affects inflation-adjustment calculations involving the most recently reported month, and only until it has been superseded with the official figure.
- 21 February 2014: Updated code to handle triple-digit earnings.
- 19 November 2008: We've modified our calculations for adjusting the nominal rates of return for inflation to be more precise. We had previously been using the Fisher equation to find the real rates of return.
- 14 May 2008: Recalculated all between-quarter dividend and earnings data to minimize rounding errors. This change primarily affects older data (post-2000 data is unaffected) and will only have a slight effect upon dividend reinvestment calculations for very long term investments.
- June 2007: Bonus update! S&P has made minor revisions in its earnings and dividend data going back to September 2004. In making these adjustments, we realized that we could project the index's quarterly dividend levels pretty accurately, so we can now do monthly updates! Now, the only thing we need to wait for is the inflation data that is released by the Bureau of Labor Statistics sometime in the third week of each month before next updating the tool all the way through the end of the previous month!
Labels: current, investing, SP 500, tool
Welcome to the blogosphere's toolchest! Here, unlike other blogs dedicated to analyzing current events, we create easy-to-use, simple tools to do the math related to them so you can get in on the action too! If you would like to learn more about these tools, or if you would like to contribute ideas to develop for this blog, please e-mail us at:
ironman at politicalcalculations
Thanks in advance!
Closing values for previous trading day.
This site is primarily powered by:
CSS Validation

RSS Site Feed
JavaScript
The tools on this site are built using JavaScript. If you would like to learn more, one of the best free resources on the web is available at W3Schools.com.
Other Cool Resources
Blog Roll


