 In analyzing the stock market, we often find ourselves going back to the concepts of basic physics. Today is no exception, in that we're going to reveal how the concept of acceleration factors into how stock prices change with time.
We'll begin with the raw price and trailing year dividend per share data for the S&P 500, which is available in spreadsheet form from Robert Shiller going back to 1871 (more current price and dividend data may be available from Standard & Poor). The price data in Shiller's spreadsheet is the average of the indicated calendar month's daily closing values for the S&P 500 index.
Next, we'll find the compound annual growth rate for each year-over-year period for both the stock price and trailing year dividends per share data. In doing this, we match the data for January 1871 and January 1872, then February 1871 and February 1872, and so on, all the way to our most recently available data, which spans from November 2007 through November 2008. Those results are graphically presented here.
Now, here's where acceleration comes into play. We'll next find the rate at which the compound annual growth rate of both the S&P 500's average monthly values and trailing year changes with time. We do this by first finding the difference between each month's growth rate and the value of the growth rate for the preceding month, then multiplying each of these values by 12 to get an annualized change. Graphing the data from February 1872 onward produces the following chart:

Let's next zoom in on the arbitrary ten year period from 2001 through 2011. We've selected this time frame since we have dividend futures data extending midway into 2010, which we wanted to incorporate for its potential relevance:

For our next trick, we're going to amplify the dividend acceleration data by multiplying all of it by a factor of 9 for this period. We obtained this number through trial and error - it's really just enough to make the peaks in each data stream roughly the same:

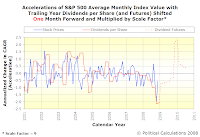
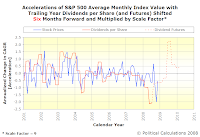
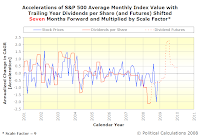
Now, the only thing that remains to to shift the trailing year dividend growth rate acceleration data forward (earlier) in time so that it roughly coincides with the accelerations in the stock price growth rate. This makes sense if what investors expect for the future value of dividends are the key driver of stock prices. We've presented our data in the table below, which shows how stock price and dividend accelerations match up when shifting the dividend data earlier anywhere from one to seven months:
 |  |  |
 | ||
 |  |  |
We find that investors typical alter stock prices in the S&P 500 anywhere from two to seven months in advance to account for expected changes in the growth rate of the index' dividends per share. We also find that they most often alter stock prices between three and four months ahead of when a corresponding change in the dividend acceleration is expected to occur (we've emphasized the four-month period in the graphs above, but could very easily have selected the three-month time shift.)
Of course, the logical consequence of all this is that if you know what stock prices are today and if you know how much their rate of growth is going to change, (and thanks to the S&P 500's dividend futures data, we do), you can predict where they're going to be in the future with a fair degree of accuracy.
The trick though, as we've shown, is to work out when they're going to get there. As you can see from our charts above, that may not be so easy!
We'll conclude this post by offering some observations from a quick survey of the full span of the historic data:
- This analysis method appears to work well when stock prices and dividends are couples (or interdependent.) It doesn't appear to work well when the relationship between stock prices and dividends has decoupled (such as occurred during the Dot-Com Bubble.)
- The scale factor by which the acceleration of dividends is multiplied changes in value over time. It may be constant for periods as long as years, but is not a constant over the entire range of data.
- Investors are generally forward looking, with stock prices most often changing as a result of investors changing their future expectations for the growth of dividends, leading the actual change in the dividends. But not always. There are times when the growth rate of stock prices lag a corresponding change in the dividend growth rate.
On a quick side note, while we're a few days late due to other posting obligations, we thought we'd celebrate our fourth anniversary with this post. Our annual anniversary tradition is to post something absolutely mind-blowing. We hope demonstrating how dividends have directly driven stock prices in the 21st century qualifies!
Elsewhere on the Web
Thanks to Gary Santoni and Alex Tabarrok, we have a pretty good idea that we're on the right track with this kind of analysis. Here's the conclusion to their 2002 paper Expected Dividend Growth, Valuation Ratios and Rational Optimism, emphasis ours:
Large changes in valuation ratios can be explained by relatively small changes in the expected dividend growth rate. We use the Gordon growth model to back out an "expected" dividend growth rate and we compare this rate with the actual rate of dividend growth. We cannot reject the hypothesis that our estimated rate is a rational expectation of the actual. As a result, a model of valuation ratios based solely on a handful of fundamentals can easily explain the variation in the data. In particular, the historically high ratios of the late 1990s and today are consistent with rational expectations about dividend growth.
Santoni, G. and A. Tabarrok. 2002. Expected Dividend Growth, Valuation Ratios and Rational Optimism. Journal of Financial and Economic Practice 1 (1): 110-119.
The main weakness of the paper is that Santoni and Tabarrok utilize the Gordon growth model, which assumes a constant growth rate for dividends, which we've shown only holds for limited periods of time. Also, in our view, Gordon's growth model dances around the real non-linear allotropic relationship between dividends and stock prices, which we uncovered just over a year ago.
Elsewhere on Political Calculations
| Essential Reading to Get Up to Speed with Us! |
|---|
| Date Posted | Post | Remark |
|---|---|---|
| 2007-12-06 | The Sun, in the Center | We used historic data for the S&P 500 to uncover the fundamental power-law relationship that exists between dividends per share and stock prices. |
| 2007-12-17 | Deriving the Price Dividend Growth Ratio | We do hard core algebra to identify what makes up the different parts of the fundamental relationship between stock prices and dividends. And a mind control experiment (we know better than to post raw math by itself in a blog post!) |
| 2008-06-24 | Stock Prices: Normal Until They're Not, But They're Not Normal! | If you've read enough of our posts, you'll note that we've often presented our data using something that looks a lot like control charts as a tool to identify significant changes in stock prices with respect to their underlying dividends per share. This post explains why! |
| 2008-08-25 | The S&P 500 from December 1991 Onward | This is the first post in which we noted that changes in the rate of growth of the S&P 500's dividends are correlated with and perhaps even drive larger changes in stock prices. |
| 2008-11-19 | The Black Monday Stock Market Crash, Explained | This is the post that directly led to this one. We identify changes in the acceleration of the growth of dividends as a key factor driving changes in stock prices. We'll be taking a closer look at this event again sometime in the future, as we were rather stunned to see the correlations apparent in the data since 2001, which we presented in this post. |
| 2008-08-28 | Hey Look - Brownian Motion! | This post looks at the Dot-com Bubble, in which stock prices and dividends per share were fully decoupled from each other, which we should note would make the kind of analysis presented in this post unworkable until the relationship is re-established. The result: unadulterated Brownian Motion (complete with video!) |
| 2008-07-15 | Defining Bubbles, Order, Disorder and Disruptive Events | We provide our operating definitions for each of these concepts describing the associated states of the stock market. |
| 2008-03-18 | Recognizing Disorder in the Stock Market | How do you know when how things were aren't the way they're going to be with stocks? We discuss how to recognize when disorder erupts in the stock market. |
| 2008-06-12 | Emerging Order in the Stock Market | The flip side to our post on how to recognize when disorder has erupted in the stock market. Plus, we introduce quantum phenonoma! |
| 2008-01-23 | Distress, Recessions, Market Bottoms and the Future | We find an interesting correlation between when the market hits bottom, recessions and peaks of distress as measured by our price-dividend growth rate ratio! |
| 2008-01-09 | The Beating Heart of the Stock Market | Here, we find we can use the price-dividend growth rate ratio as a tool to measure the level of distress in the stock market. |
| 2006-12-06 | The S&P 500 at Your Fingertips | We put the entire history of the S&P 500, including the index' price, dividends, and earnings data at your fingertips! As a bonus, we also find the rate of return between any two calendar months in the index' history, both with and without inflation and with and without dividend reinvestment! |
Update: We modified the Elsewhere on Political Calculations section of this post to incorporate our list of posts into a dynamic sorting table. Just click the column headings to sort the table by date or post title!
Labels: chaos, dividends, SP 500, stock market
Welcome to the blogosphere's toolchest! Here, unlike other blogs dedicated to analyzing current events, we create easy-to-use, simple tools to do the math related to them so you can get in on the action too! If you would like to learn more about these tools, or if you would like to contribute ideas to develop for this blog, please e-mail us at:
ironman at politicalcalculations
Thanks in advance!
Closing values for previous trading day.
This site is primarily powered by:
CSS Validation
RSS Site Feed
JavaScript
The tools on this site are built using JavaScript. If you would like to learn more, one of the best free resources on the web is available at W3Schools.com.