Previously, we created an animation of the stock market demonstrating Brownian motion during the disruptive event that preceded the current one in which we find ourselves today, the Dot-Com Bubble (which ran from April 1997 to June 2003.) In today's market though, we wonder if we're not seeing something quite different: a Lévy Flight.
First, here's our chart showing the path of the S&P 500 in 2008, with the average monthly index value plotted against the index' trailing year dividends per share:

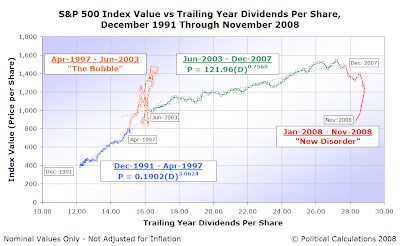
Now, let's take a step backwards and look at a longer period of time. The following chart shows the S&P 500's average monthly index value versus the index' trailing year dividends per share from December 1991 through November 2008, with the disruptive events of the Dot Com Bubble and the new disorder in which we find ourselves today emphasized:

Most of the motion we see in the path of S&P 500 stock prices with respect to trailing year dividends per share is consistent with Brownian motion, particularly in the period from December 1991 through December 2007 shown in the chart above. Since each data point represents approximately the same period of time, the number of trading days during a calendar month, we find that small movements predominate, which is consistent with the random walk behavior frequently observed in Brownian motion.
What makes a Lévy flight different is that while small, "normal" random walk movement is still frequent, exceptionally large movements are not rare events. We observe this behavior in the very large movements we observe in the stock market since January 2008.
The following chart, taken from Eric Weeks' discussion of Random Walks and Anomalous Diffusion emphasizes the difference between Brownian motion (left) and Lévy flights (right):
 |
 |
It would seem that the current chaos in the world's financial markets is, well, just that. Fortunately for investors, these are also the conditions in which self-organized criticalities develop - order will re-emerge, the only questions are when and at what level.
Labels: chaos, stock market
Welcome to the blogosphere's toolchest! Here, unlike other blogs dedicated to analyzing current events, we create easy-to-use, simple tools to do the math related to them so you can get in on the action too! If you would like to learn more about these tools, or if you would like to contribute ideas to develop for this blog, please e-mail us at:
ironman at politicalcalculations
Thanks in advance!
Closing values for previous trading day.
This site is primarily powered by:
CSS Validation
RSS Site Feed
JavaScript
The tools on this site are built using JavaScript. If you would like to learn more, one of the best free resources on the web is available at W3Schools.com.