We have one true annual tradition here at Political Calculations, and that's to celebrate Thanksgiving week in the U.S. by digging into the numbers behind the U.S. turkey-industrial complex!
We'll begin this year by taking a census of turkeys produced in the U.S. in the previous year (obviously, we can't do that for the current year, for the simple reason that the current year isn't over yet!). The chart below provides the number of turkeys produced in each year beginning in 1989:

The National Turkey Federation confirms that the number of turkeys produced in the U.S. in 2007 is 271,685,000, which represents a rebound to the level of turkeys produced by the nation's turkey farmers in the early 2000s.
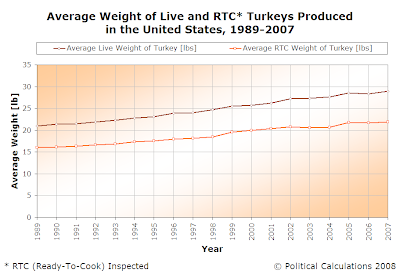
Collectively, these turkeys weighed some 7.869 billion pounds while they were alive, which is trimmed to the 5.958 billion pounds they collectively weight in the Ready to Cook (RTC) Inspected weight in which Americans find them for sale in their local grocery stores! The following chart shows what that means on a per bird basis:

In 2007, the average weight of a live turkey produced by the U.S. turkey industry was 28.96 pounds. The weight of the average Ready-To-Cook turkey delivered to U.S. grocery stores was 21.93 pounds.
Doing the math, we find that compared to the kinds of turkeys produced in 1989, the earliest year for which we have data, 2007's live turkeys are 38.25% larger. When we calculate the compound annual growth rate of live turkeys, we find that the average live turkey is increasing in weight at an average annualized rate of 1.8% per year!
Of course, all those turkeys have a cost! Fortunately for all Americans, the U.S. Bureau of Labor Statistics tracks the price per pound of whole, frozen turkey on a monthly basis. Here's their chart showing this data for each year from 2004 through 2007:

Compared to recent years, 2007 was interesting in that the price of a pound of turkey meat rose sharply from April through June, then remained very high into October of last year. This increase largely corresponds to the increase in government subsidies for ethanol producers during that period, which reduced the supply of available feed corn, making it more expensive, which in turn, made producing turkeys themselves more expensive!
We see though that after October, the price per pound of whole, frozen turkeys dropped to typical levels. We also confirm that the very best time of the year to buy whole, frozen turkeys is the month of December.
Labels: turkey
Welcome to the blogosphere's toolchest! Here, unlike other blogs dedicated to analyzing current events, we create easy-to-use, simple tools to do the math related to them so you can get in on the action too! If you would like to learn more about these tools, or if you would like to contribute ideas to develop for this blog, please e-mail us at:
ironman at politicalcalculations
Thanks in advance!
Closing values for previous trading day.
This site is primarily powered by:
CSS Validation
RSS Site Feed
JavaScript
The tools on this site are built using JavaScript. If you would like to learn more, one of the best free resources on the web is available at W3Schools.com.