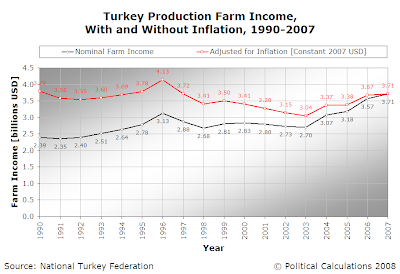
Update: We've corrected the charts and associated text to reflect the correct inflation-adjusted levels of farm income and farm income per turkey!
How much money does Big Turkey make each year? Political Calculations' Turkeymania 2008 continues today with the answer to that question!
First, here's our chart showing total aggregate turkey production farm income, both with and without inflation, from 1990 through 2007:

Next, here's what that means per turkey. We've divided the total production farm income presented in the chart above by the number of turkeys produced in each year, producing the chart below showing the average amount of farm income generated per turkey in the U.S. for each year between 1990 and 2007:

So we confirm that on a per-turkey basis, America's turkey farmers have only done better in just one year, 2006! After adjusting for inflation, we find that the average farm income per turkey produced has fallen a bit since last year, but is still well above all its other recorded values since 1990.
But we wondered how much of that income per bird might come from government agricultural subsidies. To find out, we took advantage of the Environmental Working Group's farm subsidy database to identify turkey producers who have received these subsidies for every year since 1996.
In doing that, we found that Cargill Turkey Products, a subsidiary of the mysterious Cargill Meat Solutions [Ed. Just what problems other than hunger are they solving with meat, anyway? You don't really want the answer for that, do you?] received over $17 million in "disaster subsidies" in 2002 and 2003. The subsidies they received were related to the catastrophic losses the firm incurred as a result of an outbreak of avian influenza (bird flu). Pilgrim's Pride of Virginia received disaster insurance payments totalling $11.4 million for similar losses during that period.
Aside from the disaster-related payments received in those years, it would otherwise appear that the U.S. turkey-industrial complex is blissfully free of corrupting government subsidies.
As we've shown, America's turkey farmers are doing quite well. Perhaps the rest of United States' agricultural welfare class can learn something from them and go cold turkey and go without the subsidies they currently receive.
It has, after all, worked well in other parts of the world.
Labels: business, economics, turkey
Welcome to the blogosphere's toolchest! Here, unlike other blogs dedicated to analyzing current events, we create easy-to-use, simple tools to do the math related to them so you can get in on the action too! If you would like to learn more about these tools, or if you would like to contribute ideas to develop for this blog, please e-mail us at:
ironman at politicalcalculations
Thanks in advance!
Closing values for previous trading day.
This site is primarily powered by:
CSS Validation
RSS Site Feed
JavaScript
The tools on this site are built using JavaScript. If you would like to learn more, one of the best free resources on the web is available at W3Schools.com.