Today, we're applying our wrongly-applied but perhaps very useful "control charting" technique to map out the trajectory of the S&P 500 from December 1991 to the present. Our first chart is one we've shown previously, which shows the overall movement during this period:

Let's now take a closer look at each of the periods we've identified in this chart.
The Build-up To the Bubble
In December 1991, the stock market recovered from the recession of 1991 and resumed a largely stable upward trajectory until the onset of the great stock market bubble began in April 1997:

This period in the stock market was largely characterized by low volatility, which is reflected in the low standard deviation of 19.92, which represents the typical difference between the observed stock and dividend value and our central tendency described by the mathematical formula given in the chart.
We note two periods of interest. First, the microrecession of September 1994 through March 1995. Here, we see first see an acceleration of dividends per share accompanied by declining stock prices as investors anticipated a major slowdown in the growth of sustainable corporate earnings over the period from September 1994 through December 1994. That was followed by a quarter defined by slowly rising stock prices without any growth in trailing year dividends per share as corporate earnings stalled out. Upward growth in both stock values and dividends per share resumed beginning in March 1995.
The next significant movement we see in the chart occurred between June 1996 and July 1996, as the stock market underwent a significant correction, with the stock movement just exceeding two standard deviations, which we've previously suggested potentially coincides with or precedes a breakdown in the established order existing in the stock market.
In this case, that didn't happen. Both stock prices and dividends per share resumed a stable upward trajectory following this event.
At the time, the Federal Reserve speculated that the move was initiated by investors considering the likelihood of an increased in the Federal Funds Rate after a stronger than expected jobs report was released for June 1996. Ever optimistic, the New York Times speculated that the economy was about to plunge into recession.
In both cases, we believe we see purportedly smart people attempting to assign "rational" explanations to a random event. While a large move in the relative prices of stocks with their underlying dividends per share suggests that something might be afoot, it takes more than a single two-standard deviation shift to mark the breakdown of order in the market. Given random variation, we should expect to occasionally see such a movement without a corresponding breakdown in overall stability. As we see in this case, the trajectory of the market stayed well within its defined limits.
Speaking of the overall breakdown of stock market stability, the final observation we have in this chart is the breaking of order coinciding with the onset of the stock market bubble beginning in April 1997. Using the "control limits" we've defined, we observe that this move represents enough of a movement away from the previously established order to constitute a break in that existing order.
The Bubble
The stock market bubble that ran from April 1997 into June 2003 is pretty much well defined by anything but order! As such, we didn't even attempt to incorporate central tendency curves on this chart, but rather to try to map out the bubble's path over time:

When the Bubble began inflating in April 1997, it came with the expectation of increasing corporate earnings that would support significantly higher stock prices. Stock prices raced ahead and were initially supported by increased earnings, which makes the launching of the bubble a rational event.
What happened next however could not be described as holding to any sort of rationality. The real break between stock prices and the dividends per share that traditionally underlie their valuations began in July 1998 as stock prices first declined by more than 1000 points until October 1998, when they suddenly surged by more than 1000 points in one month's time as investors began the irrational ride of their lives.
That ride continued until a more rational order was able to be re-established in the stock markets in June 2003 - and to be honest, we have a pretty hard time following the trajectory until it reached that point ourselves!
Order Resumes
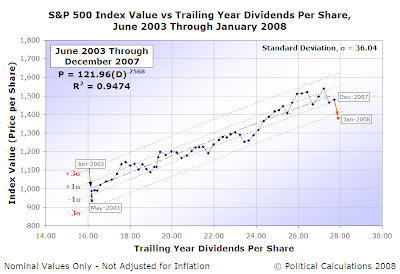
While we've previously commented upon the events of the period from June 2003 to December 2007, we'll observe here that the eventual break in order established during this period was preceded by two separate two-standard-deviation downward shifts before the observed order definitively broke down in January 2008. This final breakdown in order coincided with the shift outside the "control limits" defined by typical variation of stock prices observed during the period:

By our measures, a real breakdown in established stability in the stock market coincides with changes in the expectations that investors have for what they believe to be the market's sustainable earnings, as represented by their dividends per share.
The Market in 2008, So Far
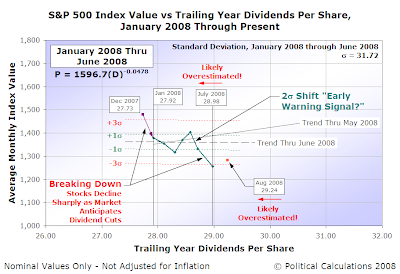
Through this point in 2008, the comparative decline in stock valuations with respect to their underlying dividends per share would appear to be largely rational. Investors have bid stock prices down in expectation of reduced levels of sustainable corporate earnings, which have occurred largely in step with actual cuts in corporate earnings. We see this in the seemingly orderly series of downward steps that we've observed to date, as the market steps down, proceeds forward, then steps down again:

What's made the period unique is that much of this activity has been largely contained within the financial and banking sector of the market. We observe this in that even though many of these institutions have acted to reduce their dividend payments as their earnings have declined, other companies outside this sector have had stronger than expected increases in their sustainable earnings stream, which has so far offset the declines of the financial sector.
Meanwhile, the decline in stock prices may be largely accounted for by the decline in the valuations of the stocks of companies within the financial and banking sector, which entered the period with rather large market capitalizations, reflecting the disporportionate representation of these companies within the S&P 500.
We expect that pattern to continue as the market sorts itself out. We just wish it would get itself sorted out faster....
Labels: dividends, SP 500, stock market
Welcome to the blogosphere's toolchest! Here, unlike other blogs dedicated to analyzing current events, we create easy-to-use, simple tools to do the math related to them so you can get in on the action too! If you would like to learn more about these tools, or if you would like to contribute ideas to develop for this blog, please e-mail us at:
ironman at politicalcalculations
Thanks in advance!
Closing values for previous trading day.
This site is primarily powered by:
CSS Validation
RSS Site Feed
JavaScript
The tools on this site are built using JavaScript. If you would like to learn more, one of the best free resources on the web is available at W3Schools.com.