 When it comes to the employment prospects for U.S. teenagers in the current economy, the effect of increasing the federal minimum wage is rather like throwing a switch. All it would seem to take for the government to throw hundreds of thousands of those Age 16 to 19 out of work is a 70 cent per hour increase in the legislated minimum pay rate!
We've previously looked at how the most recent cycle of increasing unemployment rates has coincided with significant increases in the U.S. federal minimum wage, finding that the minimum wage hikes are disproportionately affecting teenage workers. Teenagers, it would seem, have borne the greatest burden of the increased level of unemployment in the U.S. as they make up such a large share of workers paid at the lowest levels.
Since we previously only considered the situation through the end of 2007, we thought it might be interesting to see what we would find if we ran some back-of-the-envelope numbers using data from the latest Employment Situation report.
Until the job numbers for August 2008 are released, this report provides the earliest look at the impact that the latest increase of the minimum wage would have on the United States' youngest jobholders. Since the minimum wage was just increased on 24 July 2008 to $6.55 per hour from $5.85 per hour, this report would capture the leading immediate reaction of employers to the newest legislated minimum wage increase.
The federal minimum wage was previously increased from $5.15 per hour to $5.85 per hour just a year earlier on 24 July 2007.
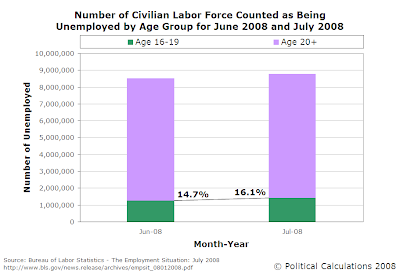
Since June 2008, Table A-1 of the report indicates that the number of people in the civilian labor force counted as unemployed has increased from 8,499,000 to 8,784,000 in July 2008. For those Age 16-19, the number of unemployed has increased from 1,253,000 to 1,415,000. As a percentage of those counted as unemployed, the unemployment share of those Age 16-19 spiked upward from 14.7% to 16.1%:

Looking now at the numerical change in the total number of people counted as unemployed between June 2008 and July 2008, we find an increase of 285,000. Meanwhile, for those Age 16-19, we find an increase of 162,000. In percentage terms, 56.8% of the increase in the number of unemployed from June to July 2008 is represented by the increase in the number of unemployed teenagers:

What's amazing is that this report only covers one week of the latest minimum wage hike! One wonders what August will bring for the teen unemployment numbers!...
Labels: minimum wage, unemployment
Welcome to the blogosphere's toolchest! Here, unlike other blogs dedicated to analyzing current events, we create easy-to-use, simple tools to do the math related to them so you can get in on the action too! If you would like to learn more about these tools, or if you would like to contribute ideas to develop for this blog, please e-mail us at:
ironman at politicalcalculations
Thanks in advance!
Closing values for previous trading day.
This site is primarily powered by:
CSS Validation
RSS Site Feed
JavaScript
The tools on this site are built using JavaScript. If you would like to learn more, one of the best free resources on the web is available at W3Schools.com.