As part of its biennial Point-In-Time count of its homeless residents, the city of San Francisco asks roughly one eighth of its homeless population what factors were the primary cause of their homelessness. The city's 2019 report provides their responses to that question from its point in time counts from 2015, 2017, and 2019, which we've visualized in the following chart.

From January 2015 through January 2019, the loss of a job represents the top response, with approximately a quarter of all surveyed homeless residents indicating that single response [1].
During these years, San Francisco's unemployment rate has fallen from 4.1% in January 2015 to 3.4% in January 2017 to 2.6% in January 2019. By itself, the city's falling unemployment rate suggests that job loss should be declining as the primary cause of homelessness because employers would be increasingly reluctant to either fire or lay off employees in such a tightening job market. Logically, since job loss is the number one cause of homelessness identified by San Francisco's homeless residents for their condition, the number of homeless in the city should also be falling.
But it's not. Instead of falling with the city's declining rate of unemployment, homelessness in San Francisco has been rising. San Francisco's 2019 Point In Time homeless count report indicates that homelessness in the city rose from 6,775 in January 2015 to 6,858 in January 2017 to 8,011 in January 2019.
It would be helpful to find out more about what kinds of jobs San Francisco's homeless residents held before they lost them, leading to their becoming homeless. Unfortunately, the survey doesn't provide that specific kind of insight, but it does provide information about the incomes earned by the portion of the city's homeless residents who are employed, who account for about 12% of the surveyed homeless population.
Assuming the jobs of the working homeless provide similar levels of income as the jobs that many homeless San Franciscans held before they lost them and became homeless, this data may tell us about their earning potential. In the following chart, we've constructed the cumulative distribution of income for San Francisco's employed homeless residents, where we find that roughly 85% earn far below the annual income that might be earned by working full time at the city's statutory minimum wage.

The city has been steadily increasing its statutory minimum wage rates, which in January 2015 stood at $11.05 per hour. In January 2017, the city's minimum wage was $13.00 per hour, and in January 2019, was $15.00 per hour [2].
With a falling unemployment rate and a rising minimum wage, we should see the cumulative distribution of income earned by working homeless San Franciscans shift to the right in each year. But we only see that from 2015 to 2017 in the chart above, and only for equivalent annual incomes between $1,200 and $18,000, where we find no meaningful shift for incomes above that level, nor do we see any significant change over all incomes from 2017 to 2019.
Since San Francisco imposes a statutory minimum wage, we can estimate how many hours the city's employed homeless are working at their jobs. The following chart maintains the cumulative distribution of income on the vertical axis, replacing the annual incomes in the horizontal axis with the equivalent hours worked at the city's mandated minimum wage.

This chart is a little more telling. Even at minimum wage, we find that over 85% of the city's employed homeless work less than full time year round, which we define as 40 hours per week, 52 weeks per year, or 2,080 hours per year. Only working part time at minimum wages would severely limit their ability to earn incomes sufficient to avoid being homeless [3].
Below the median 50% mark, we find that hours worked increased for this portion of the working homeless from 2015 to 2017, as unemployment fell and minimum wages rose. But from 2017 to 2019, as unemployment continued to fall and the minimum wage continued to rise, their hours worked fell back to 2015's levels.
Above the median 50% mark, we see hours worked decline from year to year, even though the city's unemployment rate falls and as the city's minimum wage rises. Combined with the income distribution data, this pattern suggests that the rising minimum wage either enables the homeless persons to choose to work less while earning similar levels of income or that their employers are unable to provide as many hours for them to work at the higher minimum wage, limiting any benefit they might obtain from an increased minimum wage.
It would be really interesting to analyze a more detailed breakdown of the earned income data for San Francisco's homeless as well as more information about their employers and employment.
Notes
[1] The survey allows for multiple responses to be recorded for the question. The report lists only the top responses given by the surveyed population.
[2] San Francisco's biennial point-in-time counts of its homeless population took place during January 2015, January 2017, and January 2019. The indicated minimum wages are those that applied in these months.
[3] Among the surveyed population, only 1-2 individuals per year who were counted as homeless earned annual incomes that would place them above the threshold that coincides with working full time, year round at the city's statutory minimum wage rates. That's makes for quite a lot of income inequality among San Francisco's homeless!
Labels: demographics, income distribution, minimum wage


Together, Texas and California are home to over one out of five teens between the ages of 16 and 19 in the United States. Of the two states, California's teen population is larger than that of Texas, although its population has been slowly declining in recent years while Texas' teen population has been growing. The following chart shows the population trends for working-age teens in both states from 2003 through 2018, where we find that Texas has grown from having three-fifths of California's teen population to nearly four-fifths.

Since we're focusing on working-age teens in both states, let's next look at teen employment levels in both states from 2003 through 2018.

In this chart, we see that California's working teen population plummeted by 40% from 2007 through 2011, before flattening out through 2014. It went on to rebound somewhat in 2015, but has stagnated at roughly 27% below its 2007 peak in all the years since.
By contrast, Texas saw a 29% decline in working teens from 2006 to 2011, but has since largely recovered. More remarkably, the number of working teens in Texas has periodically surpassed the number in California, in 2014 and again in 2017, despite having a teen population that is considerable smaller than that of California.
That's a pretty remarkable observation, so we've calculated the employment-to-population ratio for working-age teens in California and Texas from 2003 through 2018, showing the results in the next chart.

Here, we see that both states start out in a similar place, where from 2003 to 2005, the share of the teen population with jobs in California and Texas was about the same.
Since 2006 however, a persistent gap has opened up, with a larger share of Texas' teen population working as compared to California. In 2018, 28.1% of Texas' working-age teen population were earning paychecks, while only 22.7% of California's Age 16-19 population had jobs.
How big is that difference? If the same share of its teen population were working as in Texas, over 108,000 more Californian teens would have had jobs in 2018. At the same time, if the same share of its teen population were working as in California, over 84,000 fewer Texan teens would have jobs in the same year.
According to the BLS' preliminary data for 2018, California had 457,000 employed teens while Texas had 440,000.
There is, of course, one big difference between the two states that affects whether employers in each state even consider hiring teens to work for them.
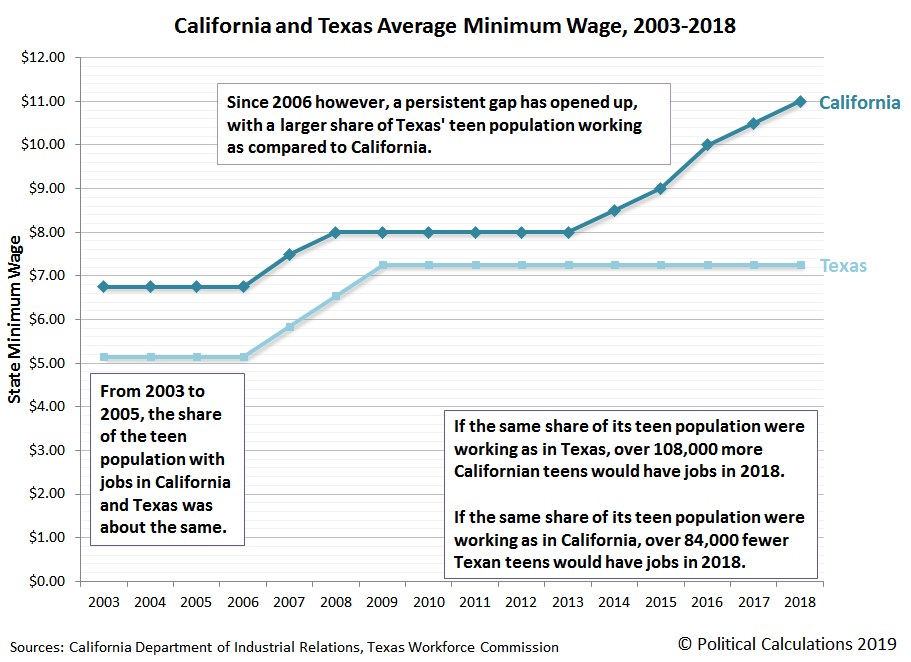
That's far from the only difference between the two states however, where things like the composition of the two states' economies and the rates at which different industries in each state are growing also play a role in determining whether there are sufficient jobs that teens can land.
Teen employment is a positive factor that help boost household incomes, help the teens gain experience that will translate into higher incomes later in life, and can even reduce the amount of student loan debt that a college bound teen might otherwise have to take on. Which state's teens do you suppose are coming out ahead?
References
Bureau of Labor Statistics. Local Area Unemployment Statistics: Expanded State Employment Demographic Data. [PDF Documents: 2003, 2004, 2005, 2006, 2007, 2008, 2009, 2010, 2011, 2012, 2013, 2014, 2015, 2016, 2017, 2018 (Preliminary)]. Accessed 8 February 2019. [Note: The BLS has data that goes back to 1999, but it changed its survey methodology in 2003, making it difficult to make valid comparisons with data collected in earlier years.]
Bureau of Labor Statistics Wage and Hour Division. History of Federal Minimum Wage Rates Under the Fair Labor Standards Act, 1938-2009. [Online Article]. Accessed 8 February 2019.
State of California Department of Industrial Relations. History of California Minimum Wage. [Online Articel]. Accessed 8 February 2019.
Texas Workforce Commission. Texas Minimum Wage Law. [Online Article]. Accessed 8 February 2019.
Labels: business, economics, minimum wage
In California, age plays a big factor in how one might see the health of the state's job market, where adults see very different prospects for collecting paychecks than the state's teenagers do.
For example, the current state of the state's job market for adults Age 20 and older might be described as "California Stalling".

While for teens from Age 16 through 19, the best way to describe the state of the job market in 2017 is "California Falling".

For a state that has been boasting about possibly having surpassed the United Kingdom to become the fifth largest economy in the world as recently as a month ago, its economy sure is showing signs of increasing strain.
References
State of California Economic Development Department. California Demographic Labor Force Summary Tables, July 2017 (and previous editions). [PDF Document]. Accessed 22 August 2017.
Labels: data visualization, demographics, jobs, minimum wage

On April Fool's day in 2015, the minimum wage in the City of Seattle was increased by city ordinance from $9.47 per hour (130% of the federal minimum wage of $7.25 per hour) to $11.00 per hour (152% of the federal minimum wage), which would be followed by two additional minimum wage hikes within the next two years.
The second minimum wage hike mandated by Seattle's 2014 city ordinance took place on New Year's Day in 2016, when the same city ordinance mandated that the minimum wage at businesses with more than 500 employees in the city rise to $13.00 per hour (179% of the federal minimum wage), while small employers were required to increase the minimum wages that they pay to $12.00 per hour (166% of the federal minimum wage). On New Year's Day 2017, Seattle's minimum wage was hiked once more for the city's largest employers to $15 per hour (207% of the federal minimum wage), while small businesses were required to pay at least $13 per hour (159% of federal minimum wage).
As anybody with common sense might reasonably predict, mandating such a series of increases in the cost of labor for a business in such a short period of time without also mandating increased revenues to support it would likely lead to reductions in the amount of labor consumed by the businesses affected by the ordinance. And in fact, a new NBER paper authored by a team of University of Washington economists who had unique access to the payroll data of affected business found exactly that.
But that's the expected result from the analysis. What was surprising was that the authors used the highly comprehensive data set to which they had access in a successful attempt to replicate the results of one of the most controversial minimum wage studies on record: the 1994 Card-Krueger case study of the relative effect of a minimum wage increase upon employment in the fast food industry in adjacent communities in New Jersey and Pennsylvania.
This paper examines the impact of a minimum wage increase for employment across all categories of low-wage employees, spanning all industries and worker demographics. We do so by utilizing data collected for purposes of administering unemployment insurance by Washington’s Employment Security Department (ESD). Washington is one of four states that collect quarterly hours data in addition to earnings, enabling the computation of realized hourly wages for the entire workforce. As we have the capacity to replicate earlier studies’ focus on the restaurant industry, we can examine the extent to which use of a proxy variable for low-wage status, rather than actual low-wage jobs, biases effect estimates.
We further examine the impact of other methodological choices on our estimates. Prior studies have typically drawn “control” cases from geographic regions immediately adjoining the “treatment” region. This could yield biased effect estimates to the extent that control regions alter wages in response to the policy change in the treatment region. Indeed, in our analysis simple geographic difference-in-differences estimators fail a simple falsification test. We report results from synthetic control and interactive fixed effects methods that fare better on this test. We can also compare estimated employment effects to estimated wage effects, more accurately pinpointing the elasticity of employment with regard to wage increases occasioned by a rising price floor.
Our analysis focusing on restaurant employment at all wage levels, analogous to many prior studies, yields minimum wage employment impact estimates near zero. Estimated employment effects are higher when examining only low-wage jobs in the restaurant industry, and when examining total hours worked rather than employee headcount.
What makes their success in replicating the results of the Card-Krueger study by filtering the Seattle data to reproduce its limitations is significant in that it effectively invalidates Card and Krueger's 1994 finding that minimum wage increases have no effect upon employment. Simply put, the limited nature of the data that Card and Krueger used to support their earlier study of the effect of New Jersey's 1992 minimum wage hike almost certainly led them to miss its true effect on employment after it went into effect.

This same issue of data detail has come up before with economists who rely upon income tax data to measure income inequality, which similarly fails to capture the true nature of the distribution of income by not providing the additional individual-level detail that other data sets provide. We've described the knowing use of such limited data without acknowledging its limitations as "analytical malpractice", which in the worst cases, crosses the ethical line into outright pseudoscience.
To be fair, we believe that the Card and Krueger's case study was a good faith effort that applied a novel approach to attempt to measure the impact of a minimum wage hike on employment. The limitations of the data they had available however meant they were weren't capable of detecting the reduction in labor hours that occurred across all employees in the industry, which the Seattle minimum wage study indicates would have negatively affected many whose wages are above the levels that would be directly impacted by minimum wage increases.
Since we've touched on the topic of pseudoscience in this post, particularly where the limitations of data are concerned, we should note that there's more going on with respect to the analysis of the impact of Seattle's minimum wage hikes that more strongly fits into that category. Specifically, as Jonathan Meer has observed:
This paper not only makes numerous valuable contributions to the economics literature, but should give serious pause to minimum wage advocates. Of course, that’s not what’s happening, to the extent that the mayor of Seattle commissioned *another* study, by an advocacy group at Berkeley whose previous work on the minimum wage is so consistently one-sided that you can set your watch by it, that unsurprisingly finds no effect. They deliberately timed its release for several days before this paper came out, and I find that whole affair abhorrent. Seattle politicians are so unwilling to accept reality that they’ll undermine their own researchers and waste taxpayer dollars on what is barely a cut above propaganda.
That sounds startingly similar to the "battle of the experts" dynamic described by former antitrust litigator David Gelfand in our Examples of Junk Science series, which we should note also fails the Goals, Progress, Challenges, Inconsistencies, Models and Falsifiability categories in our checklist for detecting junk science.
Labels: junk science, minimum wage
Where have all the jobs for teens in America gone? That's a question that was just asked in Redondo Beach, California on 6 June 2017:
While it may have been a rite of passage for previous generations, but more and more teenagers are spurring summer jobs for more schooling, according to the Bureau of Labor Statistics.
Traditionally, July is the month with the highest teen employment participation rate because school is out of session, are many sports and extracurricular activities, but the number has been decreasing dramatically in recent years. In July 2016, for instance, the teen labor force participation rate was 43.2 percent, down almost 30 percentage points from the high point of 71.8 percent in July 1978 and 10 percentage points from a decade ago, according to the BLS.
While the report shows that close to half of teens are working during the summer, that number is significantly lower than previous generations. Several reasons have popped up to explain the decline in teen workforce participation, including more older workers working past retirement age to more low-skill immigrants taking jobs that would otherwise go to teens, to teens foregoing jobs because of the low pay.
We'll stop there because neither the California journalist reporting the story, nor the BLS analyst who wrote the report that the journalist is citing, ever mention the phrase "minimum wage", which is a very remarkable omission, particularly for the BLS.
Unfortunately, Bloomberg's reporting on the topic isn't much better:
Why aren't teens working? Lots of theories have been offered: They're being crowded out of the workforce by older Americans, now working past 65 at the highest rates in more than 50 years. Immigrants are competing with teens for jobs; a 2012 study found that less educated immigrants affected employment for U.S. native-born teenagers far more than for native-born adults. Parents are pushing kids to volunteer and sign up for extracurricular activities instead of working, to impress college admission counselors. College-bound teens aren't looking for work because the money doesn't go as far as it used to. "Teen earnings are low and pay little toward the costs of college," the BLS noted this year. The federal minimum wage is $7.25 an hour. Elite private universities charge tuition of more than $50,000.
Just as a quick aside, isn't that just a completely bizarre juxtaposition in those last two sentences? As if attending an "elite private university" was a common occurrence when in reality, over 70% of Americans in college are enrolled in much less costly public universities? What an elitist snob!
But at least they mentioned the minimum wage when discussing teen summer jobs, which puts them well ahead of both the Redondo Beach Patch and the Bureau of Labor Statistics in the February 2017 edition of its Monthly Labor Review.
Let's do a quick comparison between the job market that adults (Age 20 and older) see and the one that teenagers (Age 16-19) see. And better still, let's make it more local for the Redondo Beach journalists, where we'll just look at California's labor force and employment statistics for these demographic groups, which presents the data as rolling twelve month averages to control for annual seasonality in the data. Let's first look at the Age 20 and up group's employment situation in the state for the period from January 2004 through April 2017:

In this chart, we can see that California's adult labor force has been affected by things like recessions, but is pretty unaffected by minimum wage hikes. Next, let's focus in on just California's noninstitutionalized population of working age (16 to 19 years old) residents, whose total population in the state has largely ranged between 2.0 and 2.2 million from 2004 through the present:

In this chart, we see that whenever minimum wage increase are approved or are implemented, adverse trends in teen employment levels follow. But then, that's what we should expect to happen whenever the cost of hiring the least educated, least skilled and least experienced portion of the U.S. workforce is arbitrarily increased by legislative whims.
It's the sort of thing that carries a social cost for the communities where teens live. Bloomberg's snobbish reporting on the topic was partially redeemed with the following observations:
All this studying has obvious benefits, but a single-minded focus on education has disadvantages, too. A summer job can help teenagers grow up as it expands their experience beyond school and home. Working teens learn how to manage money, deal with bosses, and get along with co-workers of all ages.
A summer job can even save lives. In a study released last month by the National Bureau of Economic Research, researchers analyzed the effects of two Chicago programs providing students with part-time jobs along with mentors for the summer. The programs had little apparent effect on the teens' later employment or education—a big concern in itself—but arrests for violent crime plunged, by 42 percent for one program and 33 percent for the other, an effect felt for at least a year after the programs ended. If teens got nothing else out of the jobs programs, the researchers suggested, they were at least "learning to better avoid or manage conflict."
Those kinds of real life lessons are all too lacking in far too many of today's schools and college campuses.
Labels: data visualization, education, jobs, minimum wage
How much will California's recently passed legislation to raise its minimum wage from its current level of $10.00 per hour to $15.00 per hour by 2021 (or 2022 at the latest) have upon the state's employment levels by age?
Before you answer, it might help to see what happened the last two times that California acted to hike its statutory minimum wage with respect to the state's labor force and number of employed. Our first chart below shows the period from January 2004 through February 2016 for Californians Age 16 or older.
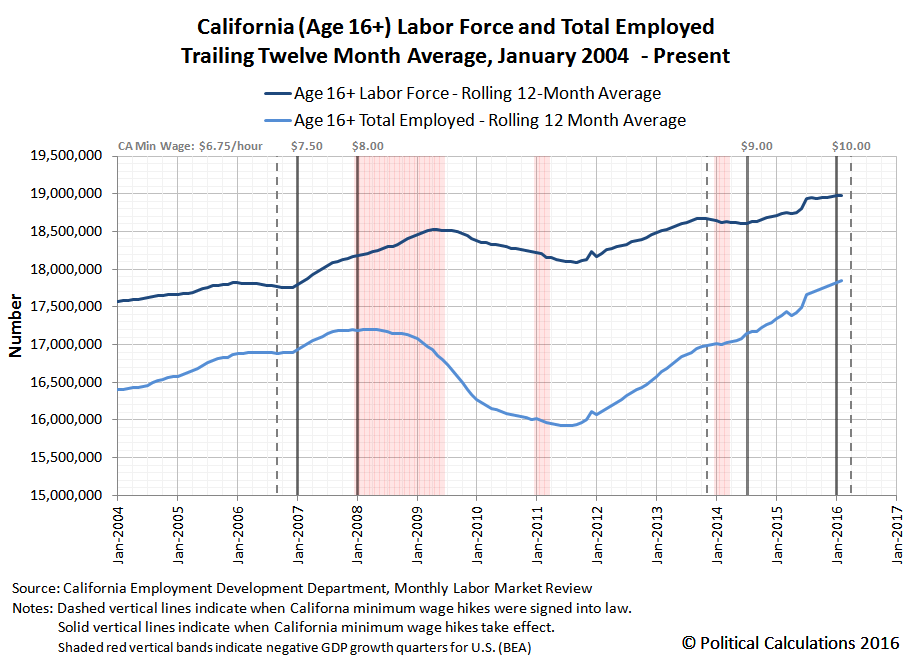
In the chart above, we've identified the timing of when the state passed legislation to raise its minimum wage (vertical dashed lines) and also the timing of when the state enacted the minimum wage hikes (vertical solid lines) defined by that preceding legislation. Beyond that, we've also indicated the quarters in which the U.S. economy experienced negative real GDP growth (vertical red shaded bands).
Next, let's look at California's adult labor force and number of employed, which we've defined as individuals Age 20 or older.
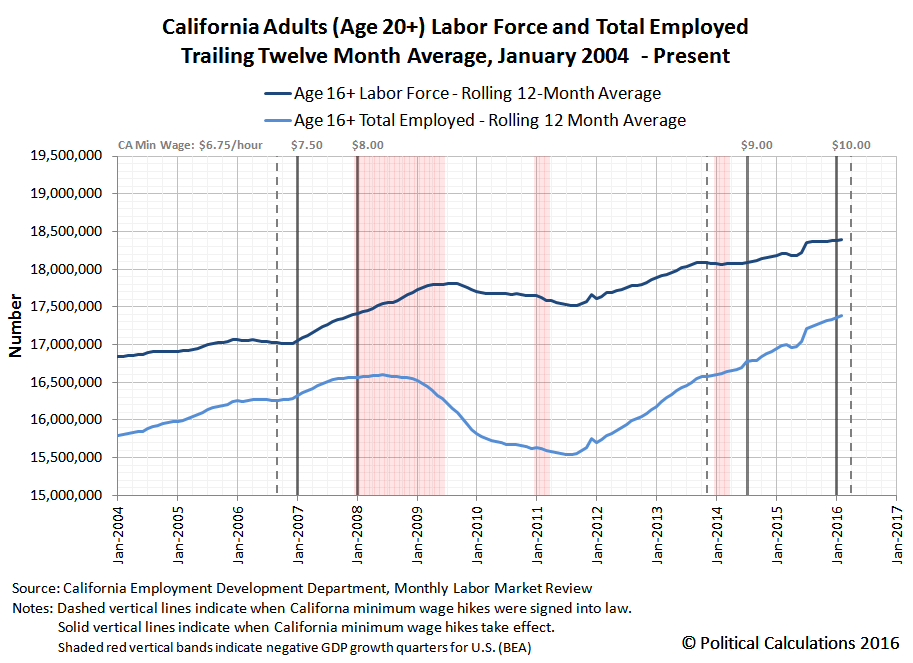
Now, compare what you see in this chart with what happened for California's teenage labor force, which we've illustrated in the following chart (please note the change in the scale of the vertical axis, which is different from the preceding two charts):

It's quite a different story for the individuals in California with the least amount of education, training and experience as compared to their better trained, more skilled and greater experienced peers in the labor force, isn't it?
That said, although we can perhaps draw a good hypothesis about what will happen between the present and 2022 from what we observe to have happened in the past, we're really more interested in what will actually influence what happens in the future. What factors might lead to a different outcome that what we've illustrated above? How might the state's politicians react if the state experiences another severe recession? And how will employers in California adapt their hiring practices in response to the state's new arbitrarily-determined minimum wage law?
Because all these things will play out in real time, the labor force and employment data we've visualized for each of these age groups is taken directly from California's Employment Development Department (EDD) monthly Labor Market Review, which directly presents the state's trailing twelve month average of non-seasonally adjusted labor force and employment data for the Age 16+ and Age 16-19 demographic groups (we subtract the Age 16-19 group from the Age 16+ group to get the data for Age 20+). The information you see above for a given month's labor force and employment levels is exactly what would have been known to California's resident labor force and its state legislators and officials within a month or two of the indicated month.
Meanwhile, the only information that reflects later refinements and revisions from the information that was previously reported is that of the negative real GDP growth quarters, which we've presented for the sake of providing some 20-20 economic hindsight for the state whose population makes up one-eighth of the entire population of the United States. This is information that California's residents and officials won't have available for quite some time after it becomes a fact of life.
We'll update these charts periodically over time as events warrant.
Data Sources
California Employment Development Department. Labor Market Review. [Latest edition: PDF Document - for previous editions, contact EDD]. Accessed 10 April 2016.
U.S. Bureau of Economic Analysis. National Income and Product Accounts. Table 1.1.1. Percent Change From Preceding Period in Real Gross Domestic Product. [Online Database]. Accessed 10 April 2016.
Labels: data visualization, demographics, minimum wage
We're going to be telling a pretty complex story today, about the first time a city with more than 25,000 residents increased the minimum wage to $15.00 per hour in the United States.
Let's start with some basic background for the City of SeaTac, Washington and the way its $15 per hour minimum wage came to be....
SeaTac and Its $15 per Hour Minimum Wage

The city of SeaTac, Washington is located between the major cities of Seattle and Tacoma, where it is about a 30 minute commute from the downtown areas of both cities during rush hour and a nearly 50 minute commute from nearby Bellevue. The city has one main industry centered on one main location, Sea-Tac International Airport, where some 4,700 people toil in commercial aviation transportation-related businesses at the airport, accounting for more than a third of the estimated 13,500 people who work within the city limits of SeaTac, which itself is home to over 27,875 people.
In 2013, SeaTac made the news for something other than the airport and being the home to a prolific serial killer. On 17 May 2013, the first proposition measure in the U.S. proposing to raise the minimum wage to $15 per hour made the ballot in the city for that year's November elections.
The Prop 1 ballot measure was aimed at the city's most-captive industry: businesses supporting Sea-Tac International Airport, where the organized labor and city politician backers of the measure sought to increase the minimum wage that would be applied to people working at the airport and also the city's transportation and hospitality businesses that serve the airport.
On 6 November 2013, the nation's first $15 per hour minimum wage measure was approved by the city's voters and became the statutory minimum wage for workers in the City of SeaTac.
But not for all of the estimated 13,100 citizens of SeaTac who had jobs at that time. Several large business based at the airport quickly sued after the measure was passed and obtained relief from a Washington state judge, who ruled that the city's new $15 per hour minimum wage would not apply for the 4,700 workers at the airport itself.
The new minimum wage did however go into effect for the 8,400 people in SeaTac who did not work at Sea-Tac International Airport on 1 January 2014.
A year after SeaTac's higher minimum wage went into effect, local news reports described little impact to SeaTac's overall economy. KING 5 reported that some 1,500 jobs in SeaTac were directly impacted by the minimum wage at the time it went into effect, meaning that these jobs previously paid wages that were less than $15 per hour. KING 5 also estimated that 400 of these jobs, or 26% of the directly affected total, were held by individuals who lived in the city of SeaTac. The Puget Sound Business Journal reported that SeaTac Mayor Mia Gregerson was "not aware of any business closing because of Prop. 1", which was seconded by SeaTac's city manager Todd Cutts.
It would not be until 21 August 2015 that Washington's state supreme court ruled in the City of SeaTac's favor to extend its $15 per hour minimum wage to workers at Sea-Tac International Airport as well. At the time of the high court's ruling, proponents of the minimum wage said that 1,300 workers in SeaTac's off-airport transportation and hospitality businesses were earning the minimum wage of $15 per hour.
Diving Into Data
Having established the context in which SeaTac's minimum wage increase came into effect, let's next consider the actual month-to-month data that shows how employment levels in the Puget Sound city has changed over time.
Which for us is pretty cool because the city level employment data that we're using is something that we didn't know existed until Mark Perry linked to it shortly after he had discovered and used it to correlate large numbers of job losses in Seattle that took place in the months after that city's minimum wage hike took effect on 1 April 2015.Since he had already looked at Seattle, we thought we'd look at another city in the Puget Sound area that made national headlines with its own minimum wage hike: SeaTac.
The data is based on detailed information that the U.S. Census Bureau collects each month as part of its Current Population Survey, where the Bureau of Labor Statistics then takes the employment data to craft its estimates of the nation's employment and unemployment levels. What we found that was new to us is that the BLS now provides access to its employment data down to a level that gives information for cities with 25,000 residents or more. Previously the closest we could get to city-level data was to consider what the Census calls a Metropolitan Statistical Area (MSA), which often includes other cities in its totals.
Because the raw data is not adjusted for seasonality, we accounted for that factor by calculating the trailing twelve month average of the reported employment data going all the way back to 2005. Because we wanted to assess the impact of SeaTac's minimum wage on its employment level, we also needed to establish a counterfactual, something that would give us an idea of what SeaTac's employment would have been if not for whatever change came about because of its action to increase its minimum wage.
Here, we took the average trend in the employment level that existed in the period from June 2006 through January 2008 as our counterfactual indicating what typical job growth was like for SeaTac outside a period of recession and abnormal (for Washington state) minimum wage hikes.
On this latter point, we should note that Washington state's minimum wage has been considerably higher than the U.S. federal minimum wage for a long time, where it has been adjusted for inflation in each year since it was first elevated above the federal level in 1999. As such, Washington state has not been affected by federal minimum wage hikes, and until 1 January 2014, the applicable minimum wage in SeaTac was Washington state's minimum wage, which was $9.19 per hour in 2013 and would have increased to $9.32 per hour on 1 January 2014.
Having now described where we got the data, and how we handled it for our analysis, which should be enough for any competent analyst to follow and replicate, let's next look at the chart we generated showing SeaTac's evolution in employment levels from January 2005 through December 2015.

Having generated this chart (without any annotations), one of the first things we did was to compare it to the chart that Mark Perry had generated for Seattle, which is where we noticed a problem.
Problems with the Data
Visually comparing the most recent data in the two charts, we couldn't help but notice that the nonseasonally adjusted data in both charts appeared to be following the exact same pattern, tick for tick, in recent months.
Meanwhile, older data in the charts did not. Our next step was to take Seattle's employment data and use it to produce a chart similar to the one we created for SeaTac's employment levels.

We see in the period before January 2014 that the trajectory of Seattle's employment level over time is very different from SeaTac's employment. We also see that the period since January 2014 appears to follow a nearly identical pattern.
Our next step was to take the trailing year average data we produced for each city's data to calculate the annualized growth rate for employment from each month to the next. The following chart reveals what we found.

In this chart, we see that SeaTac and Seattle follow similar, but different trajectories in the period preceding January 2014, and identical trajectories in the period from January 2014 through December 2015.
Although we focused on the five year period from January 2011 through December 2015, the same pattern can be seen in older data - interspersed with what appear to be population adjustments for SeaTac's data at five year intervals between December and January, which affects the data for the years 2000, 2005 and 2010. Data for SeaTac only extends back to January 1999.
What that tells us is that for the periods where both SeaTac and Seattle's month over month growth rates for their employment levels are identical is that the data jocks at either the Census Bureau or at the Bureau of Labor Statistics have not disaggregated the city level data from the overall MSA-level data.
The bad news is that this means that city-level data for cities within the Seattle MSA region is only meaningful during periods where it has been ungrouped from the whole. It may be that this level of granularity is something that comes about after the data goes through revisions - much like how the Bureau of Economic Analysis updates its estimates of GDP even years later as it accumulates more detailed information.
That affects Mark Perry's analysis of the impact of Seattle's minimum wage hike since it went into effect on 1 April 2015, as the data he used would not appear to have as yet gone through an update that would allow it to be differentiated from the full Seattle MSA. Things like layoffs in other cities in the Puget Sound region, such as Everett, Redmond, Renton and others are mixed into the data.
That's not an error on Perry's part, because there is no warning at the BLS' site interface that would alert one to that situation existing in the data. We only found it because we just happened to notice the similarity in recent data between his Seattle chart and our SeaTac chart and dug into it.
The good news is that the data for SeaTac's employment in the period before 1 January 2014 has been disaggregated from the whole Seattle MSA, so we can use it to explore some of the impact of that city's minimum wage hike.
Minimum Wage Job Loss in SeaTac
Because it's probably scrolled off your screen by now, let's look again at our chart for SeaTac's employment level....
In the chart, we see that there is a clear break in the trend for employment in SeaTac, which coincides with the May 2013 announcement that SeaTac voters would be voting on the city's Prop 1 ballot measure increasing its minimum wage to $15 per hour on 1 January 2014.
Before May 2013, we see that employment growth in SeaTac was growing at the same rate it did during our selected non-recession counterfactual period (June 2006 through January 2008). By December 2013, the data suggests that SeaTac resumed growing at its counterfactual employment growth rate. In between, SeaTac appears to have lost approximately 100 jobs.
Meanwhile, in Seattle, we see that employment was steadily rising throughout this period at the same pace as Seattle's counterfactual employment growth rate. That confirms that some factor was very definitely affecting employment in SeaTac at the time, but not employment in Seattle.
Since SeaTac city officials were unaware of any business closures or layoffs in the city related to its minimum wage hike, it is highly likely that the reduction in jobs at the $15/hour minimum wage level were spread among many businesses and quite likely achieved through attrition, where the employee leaving a job was simply not replaced.
Moreover, it suggests that employers in SeaTac were very forward-looking in using the period before the minimum wage hike would take effect to thin out their payrolls so they wouldn't have to lay them off afterward.
And since no airport workers were impacted by the city's minimum wage hike until August 2015, the reduction of 100 workers out of SeaTac's remaining 8,400 workers represents a 1.2% decline in the city's employed population. In January 2014, 1.2% jobs lost nationally would be equivalent of some 1.74 million jobs (1.2% * 145,092,000) being lost in 7 month period, which would constitute a recession by any other name.
Something to keep in mind at this point is that what the city-level employment data is really measuring is not jobs in SeaTac, but rather, the employment of people who live in SeaTac, Washington. As we saw in our earlier discussion, we know that at least 400 of the 1,500 people who would be directly impacted by SeaTac's minimum wage hike to $15 per hour actually lived in SeaTac, so if any job losses among the directly impacted minimum wage earners in the city were truly randomly distributed, minimum wage earning SeaTac residents would have a 26% chance of being included among them. The math that applies then is simply the statistics where small sample sizes are involved.
Speaking of which, if you paid close attention to our narrative above describing SeaTac and its minimum wage hike, which we've summarized directly from contemporary news sources, you will already recognize that at least 200 jobs disappeared in the city, which is the difference between the counts of 1,500 and 1,300 for the number of people employed at that minimum wage in SeaTac between 2013 and 2015.
Shall we split the difference and call it 150 job losses in SeaTac that may reasonably be attributed to the city's 63% increase it its minimum wage, plus or minus 50?
Labels: data visualization, demographics, economics, minimum wage
In the United States, there are more than 30 minimum wages. The chart below shows the evolution of state level minimum wages that have risen above the level set by the U.S. federal government in the years from 1994 through 2016.

By and large, the minimum wage is higher in states where it costs more to live, which is why the minimum wage should only ever be adjusted at the state level. Otherwise, if there were only one statutory minimum wage greater than zero that applied everywhere, you would risk creating too much real inequality between people earning the minimum wage in different states, where minimum wage earners in low cost of living states would be much richer and wealthier than minimum wage earners in high cost of living states.
Labels: data visualization, minimum wage
Last week, we used a well established method of statistical analysis to demonstrate that layoffs were beginning to spread to the states outside of the eight oil-patch states where they had previously been concentrated.
Today, we're digging into that discovery to see if we can identify the factors that are driving the statistical break in what had been a steady trend of improvement that had become established in July 2014.
Our first step is to look at the state with the biggest population of the states: California. The chart below shows the state's residual distribution of the major trends in new jobless claims filed each week from 31 May 2014 through 23 January 2016, adjusted for seasonality using the BLS' national-level seasonal adjustment factors. (Since California represents the home of one out of every eight Americans, we will assume reasonably approximates the seasonal adjustment factors that would more accurately apply to that single state's economy.)

In the chart above, we identify four main trends for new jobless claims in the state of California during the period of time since 31 May 2014.
- Trend MCA: Coincides with the national trend that began on 23 February 2013, which extended through 28 June 2014. Nationally, the trend was defined by a general improving trend of declining layoffs and new jobless claims, which fell at an average rate of 460 per week. In California however, the trend of new jobless claims was characterized by a volatile but steady increase of 130 per week.
- Trend NCA: Oil prices, which began falling in late June 2014, prompt a reversal in California's fortunes with respect to new jobless claims. From 5 July 2014 through 3 January 2015, California's new jobless claims would fall at an average pace of 486 per week. We should note that California also increased its minimum wage by $1.00 per hour, effective 1 July 2014, to $8.00 per hour right at the beginning of this change in trend.
- Trend OCA: After months of falling oil and gasoline prices, they bottom in January 2015 and begin to rebound - peaking in July 2015. New jobless claims in California also rebound in this period, rising at an average rate of 64 per week. This flat-to-upward trend for new jobless claims extends past the end of rising oil and gasoline prices, coming to an end by 5 September 2015.
- Trend PCA: Weeks after oil and gasoline prices begin falling again, new jobless claims in California begin falling at a steep rate, with the average pace of initial unemployment insurance claims filed each week plummeting by 984 per week - more than double the rate seen when oil and gasoline prices fell by a similar amount back during Trend NCA. The trend however appears to have come to a sudden end in January 2016.
Why such a difference between Trend PCA and Trend NCA? Unlike July 2014, we observe that California didn't increase its minimum wage in this period of falling oil and gasoline prices, which meant that businesses in the state, particularly those related to the fuel price-sensitive food, accommodation, travel and recreation industries, benefited from the increase in the disposable income of Californians without having their costs of doing business arbitrarily increased - allowing them to both put and keep more employees on their payroll to keep up with the improved economic situation.
That changed however on 1 January 2016, as California increased its minimum wage once again by $1.00 per hour, to its current level of $9.00 per hour.
We've previously observed that new jobless claims lag some 2 to 3 weeks behind the events that drive changes in the hiring and employee retention decisions of U.S. businesses, which corresponds to the typical weekly and biweekly payroll period that predominates throughout the U.S.
In the chart above, the sudden appearance of extreme statistical outliers on and after 16 January 2016 indicates that something changed to affect the outlook of California businesses between 26 December 2015 and 2 January 2016. Since oil and gasoline prices, a factor we've already identified to be significant where trends in new jobless claims are concerned, were still falling at that time and also in the weeks since, the factor that most likely caused the break in the established statistical trend was California's minimum wage hike.
Speaking of oil and gasoline prices, we'll close with a chart showing the average retail price of all grades and all formulations of gasoline in the period from May 2014 through January 2016.

Perhaps the most remarkable thing illustrated in the charts above is that during periods of time when oil and gasoline prices fell, the first period which had a larger decline in fuel prices combined with the immediate impact of a minimum wage hike saw half the rate of improvement in new jobless claims than the period that saw oil and gasoline prices falling by a lesser amount, but no minimum wage hike.
It's just a shame that trend had to come to an end so early after the minimum wage in California was hiked on 1 January 2016.
Labels: data visualization, jobs, minimum wage
Aren't Hollywood actors supposed to be among the most ardent supporters of left wing causes?
And as members of organized labor unions going back for decades, aren't Hollywood actors supposed to be looking out for the interests of those among their ranks who are clearly being exploited for their talent for precious little pay?
So you would think that such ardent supporters of left wing causes and union members would stand in solidarity with their fellow actors to prevent them from having their talent exploited for precious little pay. But you would be wrong, because these same people also believe that hiking the minimum wage will not cost them their jobs, but could potentially shut down the theaters where they work.
An impassioned, two-hour, open-mike meeting about the future of Los Angeles County's small-theater community Saturday at the Renberg Theatre at the Los Angeles LGBT Center in Hollywood drew an overflow crowd of well over 200 theater folks.
With just one exception, the dozens of speakers, including a calmly emphatic Tim Robbins, were motivated by a deep fear of what a proposed higher wage might do to their artistic scene.
Actors' Equity, the national union for stage actors, is seriously considering imposing a $9 hourly minimum wage for its members when they perform or rehearse in L.A.'s small venues.
Robbins and the rest think $9 an hour is exorbitant and that actors should continue working on small stages for what they have been receiving for decades. The going rate is $7 to $15 per performance, depending on ticket prices and seating capacities. Rehearsals, which can consume scores of hours, pay nothing.
Most of the small theaters are nonprofit organizations that need donations to augment ticket sales in order to sustain what's typically a hand-to-mouth existence.
Robbins is the founder and artistic director of the Actors' Gang in Culver City, launched before his 1988 ascent to movie stardom in "Bull Durham."
He stepped to a microphone wearing a pale blue denim jacket and said it made no sense for union officers to expect small theaters to survive under the proposed new terms.
We predict that many of the same actors will soon be calling for new government-funded support for the arts. But then, the government has been funding the arts for decades through government entities like the National Endowment for the Arts, so its kind of difficult to see how that would be anything more than another poorly targeted welfare program. Especially since the NEA has never funded any work that might be considered to be a significant artistic achievement.
Don't believe us? Try to name one work they've funded from the last fifty years that greatly influenced the direction of any form of art in the United States off the top of your head, without turning to Google's search engine to try to dig one up. Then turn to Google and see what stands out to you as the most influential work funded by the National Endowment for the Arts that would be instantly appreciated as such by regular Americans.
Like any bureaucracy that really only looks out for its cronies, they've mainly done mostly wasteful things that, when they have succeeded in drawing an audience of the public, was usually the result of a controversy it needlessly provoked, mainly as a device to attract a public audience in the first place.
But no work of any enduring artistic impact. That's because the artists funded by these government programs neither needed the support of the community nor of commercial audiences. And it shows, because to have an enduring impact, they would have to connect with both.
That's what makes these "exploitative" small theater groups so important and worth preserving. To survive, they have to connect with their audiences and with the communities in which they operate. That's a cauldron that develops the kind of artistic development and subsequent achievement that can stand the test of time.
But that's also a kind of competition that those who are connected with the "right" people on the left don't want to face. Which is why, after so many decades, they're out to close it down. Never mind that everyone who participates in those theater groups volunteers to do it because of how they develop their artistic potential and because of the opportunities they provide to perform.
Even if it means doing two shows a day for $7 to $15 a performance and rehearsing for free!

HT: Mish, who gave us the angle we needed to inspire us to talk about the motion picture business this eyar after we were so sorely disappointed by the reports of how lame the 2015's Academy Awards ceremony was. [Message to the Academy: Joan Rivers was the only one who made watching any portion of the "ceremonies" tolerable - it was a big, bad mistake to snub her among the posthumous recognitions!]
Labels: academy awards, minimum wage
Want to see what a structural change in the U.S. economy looks like?
The chart below tells the employment story for U.S. teens between the ages of 16 and 19 using the latest jobs data reported by the U.S. Bureau of Labor Statistics. Only this time, we've broken the story into two different categories: one for teens between the ages of 16 and 17 and another for teens between the ages of 18 and 19.

Some quick notes about the civilian noninstitutional population of U.S. teens during the ten years from January 2005 through January 2015:
- Looking just at U.S. teens between the ages of 16 and 17 from January 2005 through January 2015, their numbers start out at 8,866,000, rise to peak at 9,419,000 in October 2006 before slowly declining to their lowest number in the period of 8,466,000 in August 2011 and rising once again to 8,860,000 in January 2015. Which coincidentally, is an almost identical value to that recorded exactly 10 years earlier!
- The civilian noninstitutional population of U.S. teens between the ages of 18 and 19 is always lower than the equivalent population of Age 16-17 U.S. teens recorded two years earlier. While the enlistment of these teens in the U.S. military is the largest factor accounting for that discrepancy, other factors that reduce the civilian noninstitutional population of 18 and 19 year olds include the following in considerably lower numbers: criminal incarceration, psychiatric institutionalization, death, et cetera. Enrollment in school, whether high school or college, does not classify these individuals as being institutionalized.
- The number of civilian noninstitutionalized teens Age 18-19 begins the period in January 2015 at 7,436,000, before falling to reach their lowest recorded value of 7,367,000 in October 2006. The Age 18-19 population begins to rise to reach its maximum value of 8,284,000 in August 2011 before falling back once more to January 2015's figure of 7,776,000.
- Adding both subgroups of working age U.S. teens together, the total civilian noninstitutional population of U.S. teens between the ages of 16 and 19 in January 2005 was 16,302,000, which slowly rose to peak at 17,126,000 in December 2008, before slowly declining since to reach January 2015's population total of 16,636,000. Along the way, the total number of Age 16-19 teens was 16,776,000 in October 2006 (when the number of Age 16-17 teens peaked as the number of Age 18-19 teens reached its trough), while the total number of noninstitutionalized U.S. 16-19 year olds was 16,649,000 in August 2011, when the number of 16-17 year olds troughed and the number of 18-19 peaked.
The only exception to that pattern is observed in the period since June 2014, where falling oil and fuel prices across the nation have offset or muted the expected negative impact of the minimum wage rising in California in July 2014. We should note however that unlike teens elsewhere in the U.S., California teens have seen no significant gains in employment.
Also unlike the pattern observed for older Americans, U.S. teens have seen minimal, if any, improvement in their employment situation since the end of the December 2007-June 2009 recession.
Curiously, the percentage decline in the population of Age 16-17 and Age 18-19 teens with jobs is nearly the same - with about 10% fewer of the population of each subgroup counted as having jobs in the aftermath of the implementation of the minimum wage hikes/recession. Coincidentally, even though teens represent up to one quarter of all those who actually earn the minimum wage in the U.S., only about 10% of teens actually earn wages that fall within the range that would be directly affected by the minimum wage hikes that occurred.
As we see in the chart, the practical effect of all the minimum wage hikes that occurred from 2007 through 2009 was to remove the jobs available for this portion of the U.S. civilian noninstitutionalized labor force.
That is the result of a structural change in the U.S. economy, where changes in the laws mandating the amount of the minimum wage at the federal, state and local levels have made it too costly for employers with little ability to increase their revenues to continue to hire the members of the least educated, least skilled and least experienced portion of the U.S. workforce: Americans between the ages of 16 and 19. Their ability to generate revenue for the businesses who might employ them is too little to justify the cost of employing them at the governments' mandated minimum wages.
Labels: jobs, minimum wage

Now that we've established what the relative purchasing power of a dollar is in each of the United States, we're going to apply that information today to solve one of the great problems of our time: how to set the minimum wage in each state in order to achieve purchasing power equality.
After all, it goes against the ultimate liberal ideals of fairness and equality of outcomes if, thanks to nothing other than the relative cost of living in each state, that a minimum wage earner in Mississippi is able to buy more things with their earnings than can a person earning the identical wage in a high cost of living state like New York.
Clearly, in the interest of fairness and of achieving purchasing power equality, the minimum wage in each state needs to be adjusted in such a way that a person who earns the minimum wage in each state can buy no more and no less than the same amount of real goods and services. That's the great problem for society that we'll be solving today.
Let's start by examining the applicable minimum wage that applies to each state in 2012, the year for which we have the relative purchasing power data, which is the greater of either the state's own minimum wage or the federal minimum wage of $7.25 per hour. That data is directly encoded in the interactive map below:
Next, let's calculate what each state's minimum wage would have to be so that the individual's who earn it will have an equal amount of purchasing power, regardless of the state in which they might live. Here, we've used the federal minimum wage of $7.25 per hour as the benchmark for calculating the minimum wage levels in each state that would achieve purchasing power equality across the entire nation.
Finally, we calculated how much each state would need to adjust their minimum wage levels in order to realize the very achievable dream of purchasing power equality for minimum wage earners throughout the United States.
What this exercise demonstrates is that if one really cares about achieving equality, it makes absolutely no sense to impose a national minimum wage, which we observe produces the situation where the minimum wage earners in some states are considerably worse off than individuals earning the same wage in lower cost of living states - the very essence of income inequality and unfairness.
Labels: data visualization, economics, income inequality, minimum wage, satire
There are two Californias. There is one where adults (Age 20 and over) are gaining jobs at a rate that's slightly faster than was the case in the years before the December 2007-June 2009 recession in the U.S.

And there is the one where teens (Age 16 to 19) are falling further and further behind in the job market.

Notes and Observations
The data in both charts is the trailing twelve month average for non-seasonally adjusted data. Taking the trailing year average of this data allows us to account for the effect of seasonality in the data.
California increased its minimum wage from $6.75 per hour to $7.50 per hour on 1 January 2007. The effect upon teens in the labor market was minimal since California's economy was still growing, which allowed employers to somewhat offset the 11% increase at the time. That said, instead of keeping pace with the job market for adults, we see that the employment situation for California's teens basically flatlined during 2007. We also see that the number of employed teens began falling in the months prior to the minimum wage increase, as employers anticipated the hike.
California increased its minimum wage from $7.50 per hour on 1 January 2008. Once again, the job market for adults was little affected, with the number of employed Age 20+ Californians growing through July 2008 before finally being negatively impacted by economic contraction and its associated deflationary pressures.
By contrast, the employment situation for Californians teens began deteriorating rapidly after the higher minimum wage was imposed, with the rate of decline in the number of employed teens in the state not decelerating until September 2010 - one year and three months after the recession in the U.S. ended, before beginning to decline at a much slower pace.
Meanwhile, adult Californians saw their job market turn around months earlier, growing at a pace similar to that from before the recession through July 2011, then at a faster pace afterward.
The job market for teens in California didn't bottom out until January 2012, then began recovering at a much slower pace than that for adults. That slow rate of improvement lasted through December 2013. Since January 2014, the trailing twelve month average for the number of employed teens in California has been falling in the months in advance of the state's next minimum wage hike from $8.00 per hour to $9.00 per hour on 1 July 2014.
Throughout all this time, California has been home to one out of 8 teens in the United States. In January 2005, one out of 10 employed teens in the U.S. lived and worked in California. In May 2014, one out of 12 employed teens in the U.S. lived and worked in California.
Americans between the ages of 16 and 19, by the way, make up approximately 25% of all individuals who earn the minimum wage in the United States.
Labels: demographics, jobs, minimum wage, recession
Welcome to the blogosphere's toolchest! Here, unlike other blogs dedicated to analyzing current events, we create easy-to-use, simple tools to do the math related to them so you can get in on the action too! If you would like to learn more about these tools, or if you would like to contribute ideas to develop for this blog, please e-mail us at:
ironman at politicalcalculations
Thanks in advance!
Closing values for previous trading day.
This site is primarily powered by:

CSS Validation

RSS Site Feed

JavaScript
The tools on this site are built using JavaScript. If you would like to learn more, one of the best free resources on the web is available at W3Schools.com.
Other Cool Resources
Blog Roll


