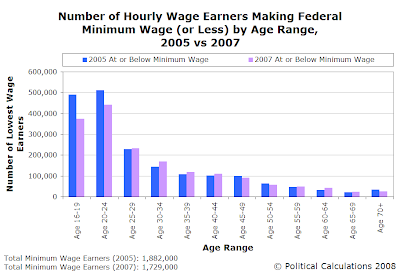
Now that we've shown that minimum wage earning jobs for teenagers are disappearing, we thought it might be useful to look at how the composition of the minimum wage earning workforce by age group has changed between 2005 and 2007, as well as some other data we assembled in looking at those changes.
First, here's a chart illustrating the relative percentages of minimum wage jobs for 2005 (the underlying data is taken from Table 7 of the BLS' Characteristics of Minimum Wage Earners, 2005):

And here's the corresponding chart for 2007 (the underlying data for this chart is taken from Table 7 of the BLS' Characteristics of Minimum Wage Earners, 2007):

Where in 2005, minimum wage earners between the ages of 16 and 24 represented 53.3% of the total number of minimum wage earners, we now see that in 2007, minimum wage earners in the Age 16-24 group dropped to just 47.1% of the total. As we showed yesterday, the vast majority of minimum wage jobs lost between 2005 and 2007 were those that employed individuals in these age ranges:

The decline in the number of minimum wage earning jobs for the Age 16-19 group is 118,000, while the corresponding decline over the same period for the Age 20-24 group is 71,000, combining for a total decrease of 189,000. Between 2005 and 2007, there was a net increase of 36,000 minimum wage earning jobs for all the other age groups, which reduced the total number of minimum wage jobs by 153,000. This net decrease represents an 8.1% reduction in the number of minimum wage earning jobs from the level of 1,882,000 recorded in 2005.
General Economic Conditions, 2005 through 2007
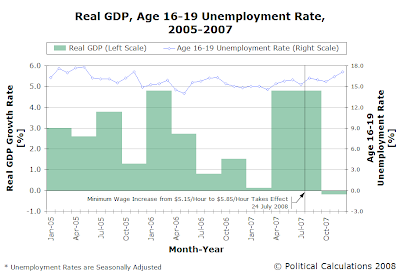
One factor that we didn't address in our post yesterday was the general economic conditions operating in the United States during both 2005 and 2007, specifically the unemployment rate for the Age 16-19 workforce and GDP, which was recently revised. The chart below presents both streams of data from January 2005 through December 2007:

In 2005, real GDP in the U.S. grew at an average rage of 2.7%, while the average monthly rate of unemployment for all 16-19 year olds was 16.5%. The average monthly number of individuals employed during 2005 was 5,974,333 and the average monthly number of unemployed individuals was 1,184,750.
For the sake of filling in the year in the middle, in 2006, real GDP in the U.S. grew at an average rage of 2.5%, while the average monthly rate of unemployment for all 16-19 year olds dropped to 15.4%. The average monthly number of individuals employed during 2006 was 6,160,417 and the average monthly number of unemployed individuals was 1,115,583.
In 2007, real GDP in the U.S. grew at an average rage of 2.4%, while the average monthly rate of unemployment for all 16-19 year olds was 15.7%. The average monthly number of individuals employed during 2007 was 5,914,667 and the average monthly number of unemployed individuals was 1,101,583.
The next chart shows the number of unemployed individuals and number of individuals in the Age 16-19 workforce between 2005 and 2007:

This chart shows that the total employment level of teenagers in the U.S. workforce immediately declined following the increase of the minimum wage in July 2007. From January 2005 through July 2007, the average monthly number of individuals counted as part of the Age 16-19 workforce was 7,182,484. From August 2007 through December 2007, that number dropped to 6,951,800, a 3.2% decrease.
Most interesting, that dip began during a time when the U.S. economy was growing at a 4.8% annualized rate (after adjusting for inflation). You could understand if the total employment began declining in the fourth quarter of 2007, when the economy clocked in with a negative annualized rate of growth of -0.2%, but that certainly was not the case when the teen workforce suddenly shrank in August 2007.
Labels: gdp, jobs, minimum wage, unemployment
Welcome to the blogosphere's toolchest! Here, unlike other blogs dedicated to analyzing current events, we create easy-to-use, simple tools to do the math related to them so you can get in on the action too! If you would like to learn more about these tools, or if you would like to contribute ideas to develop for this blog, please e-mail us at:
ironman at politicalcalculations
Thanks in advance!
Closing values for previous trading day.
This site is primarily powered by:
CSS Validation
RSS Site Feed
JavaScript
The tools on this site are built using JavaScript. If you would like to learn more, one of the best free resources on the web is available at W3Schools.com.