The order that we speculated had formed in the stock market in the aftermath of its January 2008 plunge is very likely over. The chart below shows the gory details for S&P 500 in the now ended month of July 2008:

Using the formula presented in the chart, we can confirm that the stock market is roughly 103 points below where the relationship between stock market prices and trailing year dividends per share would place it. We're calling this order broken as we've seen two things: a four standard deviation change in the value of the stock prices with respect to their underlying dividends per share over the last two months and that stock prices have shifted out of the range defined by the "control limits" where we would expect they would be if the market were behaving in an orderly fashion.
The single driving factor behind the stock market's decline is the state of banking and other financial institutions in the U.S. While these companies remain distressed, the potential negative impact on dividends will continue weigh on the stock market as investors anticipate poor performance from this sector of the U.S. economy.
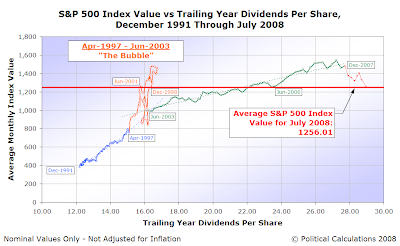
Let's now put this recent activity into a bigger context. The following chart shows major market movements going back to December 1991:

This chart reveals that stocks were last at this level in June 2006, or if we go back to the stock market bubble of the late 1990s, both December 1998 and June 2001. Regular readers will remember why we consider anyone representing ten-year stock returns as being representative of stock market performance during the last ten years or being meaningful in any way to be junk peddlers!
As for what this means for investors today, we don't know yet. For our methods to work, we need more data, for which we need more time. What we do know is that if the market behaves as it has in the past, and especially as it has in the modern (post-1952) era, a stable relationship between stock prices and dividends will once again re-emerge in the stock market. It's just going to take a while longer to get there.
In the meantime, we can expect that disruptive events will continue to drive the stock market. At the very least, until the financial sector in the U.S. gets their collective fiscal house in order.
Labels: dividends, forecasting, SP 500, stock market
Welcome to the blogosphere's toolchest! Here, unlike other blogs dedicated to analyzing current events, we create easy-to-use, simple tools to do the math related to them so you can get in on the action too! If you would like to learn more about these tools, or if you would like to contribute ideas to develop for this blog, please e-mail us at:
ironman at politicalcalculations
Thanks in advance!
Closing values for previous trading day.
This site is primarily powered by:
CSS Validation
RSS Site Feed
JavaScript
The tools on this site are built using JavaScript. If you would like to learn more, one of the best free resources on the web is available at W3Schools.com.