 Lots of people have been pointing recently to the ten year rates of return for the various stock indices and observing: gosh, the market today is lower than it was ten years ago. We've lost a decade!
This is one of our pet peeves. The problem with using rates of return like this to evaluate stock market performance is that they're locked into the data at just two dates: the value of stocks at the beginning of the period and the value of stocks at the end of the period in question. This method of measuring market performance can work a lot of the time, but doesn't always give you a clear picture of what was going on in the stock market over the given interval.
For this kind of measure to be genuinely indicate the market conditions over the period you're looking at, you should be able to slightly shift the starting and end dates of when you're finding the rate of return without drastically changing the rate of return you get. (You can use this tool to do just that for the S&P 500!) If you do this and you get dramatically different numbers, that tells you that something significant was going on in the stock market at either the beginning of the period or at the end, or quite possibly both.
Our pet peeve in particular is that the people who do this sort of thing often omit the details behind what was going on in the stock market at the beginning or end of the period for which they are providing the rate of return, in our view, either through laziness or to intentionally mislead their readers (the example linked above is most likely laziness.)
The reason why this may be important to you is that the conditions of the stock market are something that you might want to know as an investor so you can factor into your investment decisions just how typically or atypically the stock market has been performing over the time in question. For example, if you knew we were in a stock market bubble (we're not), you might routinely set a number of stop loss orders at increasing levels to minimize any losses you might incur from when the bubble pops!
So how does that matter over these particular past ten years? Between April 1997 and June 2003, the stock market was passing through the disruptive event now known as the Dot-Com Bubble. The prices of stocks were highly inflated during this period and fully decoupled from the underlying fundamentals that have always driven their values. As a result, any comparison between stock prices then and now must note that the conditions at the beginning of these ten periods were highly atypical.
To see what we mean, here's a chart showing the period from December 1991 through June 2008 upon which we've indicated the average monthly value of the S&P 500 as of 15 July 2008 to show how it compares with stock prices over the period:

So, just how typical do you think the rates of return will be over ten year periods from April 1997 through June 2003?
If you said "not very," you're right!
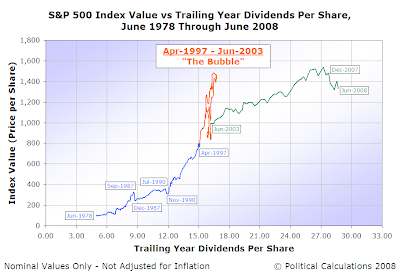
Of course, there's nothing like more data to back up the point as to how atypical the stock market action was during this period, so this next chart shows the same data over the past 30 years from June 1978 through June 2008, highlighting some dates of interest:

Black October (September 1987-December 1987) and the pre-Gulf War dip (June 1990-December 1990) stand out, as well as perhaps today's market turmoil (beginning in January 2008), but in scale and scope, none compare to the Dot Com Bubble.
Just something to remember that when someone who ought to know better starts spouting off about how bad the last ten years have been for stocks!
Labels: SP 500, stock market
Welcome to the blogosphere's toolchest! Here, unlike other blogs dedicated to analyzing current events, we create easy-to-use, simple tools to do the math related to them so you can get in on the action too! If you would like to learn more about these tools, or if you would like to contribute ideas to develop for this blog, please e-mail us at:
ironman at politicalcalculations
Thanks in advance!
Closing values for previous trading day.
This site is primarily powered by:
CSS Validation
RSS Site Feed
JavaScript
The tools on this site are built using JavaScript. If you would like to learn more, one of the best free resources on the web is available at W3Schools.com.