Now that we've established that the Price-Dividend Growth Ratio we invented last December is capable of providing a near real-time indication of the level of distress in the stock market, a logical question to ask is: How does the level of distress present in the stock market correspond to the bottoms of the market during recessions?
We figure that particular question has to be pretty interesting to anybody who has money in the market, or is trying to figure out when to put money into the market!
To find out the answer to that question, we took our chart showing the correlation of stock market distress and economic recessions in the U.S. and mapped out where the stock market bottomed out during the periods of recession. The resulting chart is below:

The values shown on the chart above are the average monthly index value of the S&P 500 in the month in which the index reached its lowest value after the U.S. economy entered a period of recession. We also limited our initial analysis to the years from January 1952 through December 2007, the most recently completed month for which we have full data for the S&P 500. This period also corresponds with what we've previously identified as the modern era of the U.S. stock market.
As a general rule of thumb for this modern era, stock market bottoms would appear to coincide with peaks in the absolute value of distress indicated by the Price-Dividend Growth Ratio. As we've noted previously, this ratio spikes when the year-over-year rate of growth in S&P 500 dividends per share approaches a value of zero.
Update 18 February 2008: The analysis below is flawed. While the analysis would be valid if we were using the correct total estimate for dividends per share for the first quarter of 2008, we erred in not incorporating the value of dividends already paid in the first quarter into our calculations, as these are not included in the dividend futures data that we did use. More details....
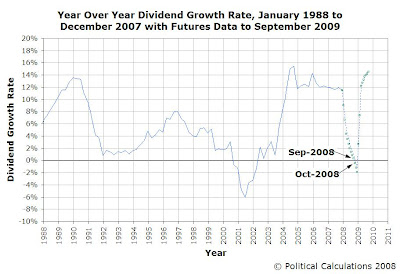
As of the futures data we have that applies from 23 January 2008 onward, the S&P 500's dividend futures indicate that this rate will reach a value of zero sometime in either September or October 2008, continuing into negative territory through December 2008, with a recovery in the dividend growth rate occurring rapidly afterward:

This data would seem to suggest that the stock market will be a much nicer place for investors after the peak of distress in the market has passed, potentially as early as November 2008, as our chart showing market bottoms with the Price-Dividend Growth Ratio indicates that market bottoms typically, but not always, follow the peak of market distress in the modern era.
The Future Isn't Certain
In our dividend growth rate chart above, we've shown the change in dividend futures data from when we first noted it for 15 January 2008 (the blue dashed line) to the latest data we now have available through 23 January 2008 (the green square datapoints.) In just that week-long period, the dividend futures data shifted to indicated a steeper and deeper decline in the year-over-year dividend growth rate for 2008. Where the previous data had suggested the dividend growth rate would pass through the zero level in October or November, the newer data now indicates that this will occur a month earlier. Unsurprisingly, the futures data can be volatile, so anyone looking to make their own investing decisions based on the data we've presented above should take that fully into account.
We'll revisit all this data again on 20 February 2008, when we will next update our tool for finding the rates of return for investments in the S&P 500 between any two months from January 1871 through January 2008!
Previously on Political Calculations
- Mapping S&P 500 Performance, Since 1871
- The S&P 500 at Your Fingertips
- Visualizing the Worst Case Real Returns for the S&P 500
- The Worst Returns Ever for the S&P 500
- Visualizing the Best Case Real Returns for the S&P 500
- The S&P 500's Golden Years
- The Worst Returns of the S&P 500 vs The Safest Investment in the World
- The Five Worst Bear Markets Since 1871
- The Five Worst Months in S&P 500 History
- The Five Best Months in S&P 500 History
- The Problem with Earnings
- Do Drops in Corporate Earnings Lead to Recession?
- The History of S&P 500 Dividends in Pictures
- The Sun, in the Center
- Deriving the Price-Dividend Growth Ratio
- Retrograde Earnings
- The Beating Heart of the Stock Market
- Update: The S&P 500 at Your Fingertips
- All Our Posts Tagged with "SP 500"
- All our Posts Tagged with "recession forecast"
Labels: recession forecast, SP 500, stock market
Welcome to the blogosphere's toolchest! Here, unlike other blogs dedicated to analyzing current events, we create easy-to-use, simple tools to do the math related to them so you can get in on the action too! If you would like to learn more about these tools, or if you would like to contribute ideas to develop for this blog, please e-mail us at:
ironman at politicalcalculations
Thanks in advance!
Closing values for previous trading day.
This site is primarily powered by:
CSS Validation
RSS Site Feed
JavaScript
The tools on this site are built using JavaScript. If you would like to learn more, one of the best free resources on the web is available at W3Schools.com.