But to give credit where credit's due, we actually got the idea over at William Polley's blog in the comments thread!
Now, we've done something like this before with our Lemony Snicket and the S&P 500 scenario tool, but we didn't match the recorded worst-case stock market performances with the actual inflation in play over the periods of time for the investment.
So today, we're going to present what we found when we ran the numbers for the actual worst case inflation-adjusted returns ever realized in the entire history of the S&P 500 index!
For our scenario, we found the future value of a series of once-a-year $1000 investments as if they had earned the worst-ever recorded real rates of return for periods of time from 1 to 50 years long. Then we added the totals to find the progressive cumulative value of our "really, really bad timing" investor portfolio.
We'll also compare these values against those obtained from an investment that receives a 0% real rate of return, which is roughly the equivalent of investing in 30-day T-bills. We'll also find the future value of an investment that produces a positive 2% and 3% real rate of return, which spans the typical range for long-term U.S. Treasury bonds.
As an interesting side note, stuffing money in a mattress actually loses money over time through the cumulative effects of inflation, which is why investing in very short term U.S. Treasuries is needed to produce a 0% rate of return.
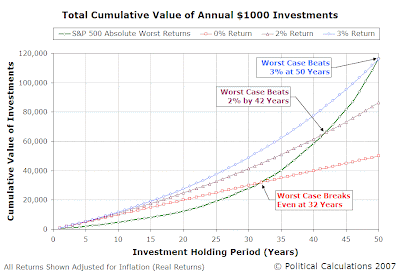
The chart below illustrates what we found. All values presented reflect real, or rather, inflation-adjusted, returns, with full dividend reinvestment and do not account for fees, commissions or taxes that might have to be paid over the period of the investments. (We'll assume, in other words, that our hypothetical investor has other money they might use to cover these costs.):

It's no secret that if you have really bad luck with your investments, you can expect to lose money. What is a secret is if you had really bad luck with your investments in the S&P 500, you would actually have broke even and moved into the black after a long period of time.
How long? Well, to break even and achieve a 0% real rate of return on the cumulative value of your horribly-timed portfolio, you can expect 32 years of pain before you get out from being underwater!
And then, believe it or not, you start making money, even with regularly having the actual worst-case historical real rates of return ever recorded by the S&P 500. In fact, you would have netted a positive 2% real rate of return in a little under 42 years. At 50 years, had you made these terrible investments, you would have realized a solid 3% real rate of return on the sum total of your truly awful portfolio.
That says a lot about the strength of the component stocks within the S&P 500, the diversification they provide to reduce risk and the buy and hold investing strategy.
It also says a lot about our hypothetical investor. That's a lot of stubbornness (or faith) working if they're willing to go through 32 years of being in the red before breaking even. Now, imagine if that voice in our stubborn investor's head telling them every day how bad their investments are is Jim Cramer's. Kind of redefines hell, doesn't it? [Editor's Note: Sorry Jim, we couldn't resist!]
Then again, no one has actually ever done that badly with their S&P 500 investments, which maybe is the real point to take away from this exercise.
Labels: investing, SP 500, stock market, worst case
Welcome to the blogosphere's toolchest! Here, unlike other blogs dedicated to analyzing current events, we create easy-to-use, simple tools to do the math related to them so you can get in on the action too! If you would like to learn more about these tools, or if you would like to contribute ideas to develop for this blog, please e-mail us at:
ironman at politicalcalculations
Thanks in advance!
Closing values for previous trading day.
This site is primarily powered by:
CSS Validation
RSS Site Feed
JavaScript
The tools on this site are built using JavaScript. If you would like to learn more, one of the best free resources on the web is available at W3Schools.com.