We're going to be unveiling the most remarkable stock market-related chart ever tomorrow, but as part of the build up to what we're going to present, we thought it might be useful to consider the history of dividends for the S&P 500 and its precursor composite indices since 1871. The following charts are all drawn from our data, spanning January 1871 through November 2007.
First up, our very basic look at the S&P 500's average monthly dividends per share, not adjusted for inflation, over the entire history covered by our data:

Since January 1871, the S&P 500 rolling annual dividends have grown from $0.26 per share to $27.56 per share through November 2007, which works out to be a compound annual growth rate of 3.47% for this entire 136.83 year period!
Next, we'll look at the S&P 500's dividend yield, in which the index' dividends per share are divided by the index' price per share and expressed as a percentage, throughout this same period:

Beginning with a value of 5.9% in January 1871, the dividend yield of the S&P 500 has ranged between its all-time-low of 1.1% in August 2000 and its all-time-high of 13.8% in June 1932, averaging 4.5% overall. As of November 2007, the dividend yield of the S&P 500 is 1.9%. One thing we note from this chart is that the dividend yield of the S&P 500 was typically above its long-term average from January 1871 through November 1954 and has typically been below that level since then.
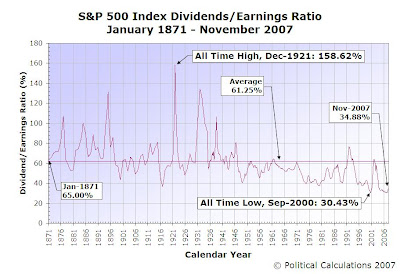
Our next chart considers the relationship between the S&P 500's dividends and earnings. As we recently discussed, dividends are the portion of company earnings that the company's leadership believe to be sustainable for the foreseeable future. We've expressed this relationship as the percentage of the S&P 500's rolling annual dividends per share and the rolling annual earnings per share in the chart below:

Here, we find that beginning with January 1871's value of 65%, the percentage of the S&P 500's dividends with respect to earnings per share has ranged between an all-time-high of 158.62% in December 1921 and an all-time-low of 30.43% in September 2000, averaging 61.25% overall. As of November 2007, the S&P 500's ratio of one-year trailing dividends per share to its earnings per share is 34.88%.
As with our dividend yield chart, we note that prior to January 1952, the S&P 500's dividend-earnings ratio was typically above it's long term average of 61.25%, while it has been typically below this level ever since.
There is, in effect, a division between the general level of dividends per share that occurs in this time frame. The following chart illustrates the major periods of the S&P 500's dividends:

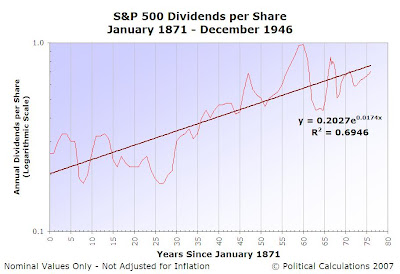
We find that there is a major transition between the typical level of S&P 500 dividends that coincides with the period from January 1947 through December 1951. Prior to this transition, the typical growth rate of S&P 500 dividends per share grew at a annualized growth rate of 1.74%, with a considerable amount of volatility (the chart below presents this growth on a logarithmic scale):

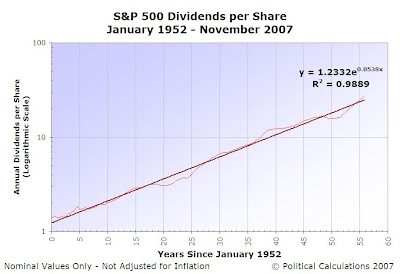
Since January 1952, the growth rate of the S&P 500's dividends per share has been much less volatile, and also much larger, clocking in at an average annual rate of growth of 5.38% (also shown on a logarithmic scale):

We believe this apparent transition in average annual dividend growth rates might be explained by one of the three possible scenarios:
- The post-World War II transition period saw the lifting of New Deal era and World War II driven wage and price controls. During the years when these economic constraints were in effect, companies learned to operate in a lean manner. Once unshackled from these restraints, and combined with a surge in productivity driven by the return of highly skilled workers from wartime duty, corporate earnings surged, followed by a corresponding surge in dividends.
- It's the result of a mathematical artifact. The S&P 500, as we know it today, was originally introduced in January 1957. Prior to that, Standard and Poor maintained the S&P Composite index, which was originally introduced in 1926 as a composite of 90 companies, which was later expanded to 225, and later still to over 400.
Since the companies that made up the S&P 500 in 1957 were all in existence much, much earlier, it might be possible that S&P backfilled five previous years of data (going back to January 1952), which accounts for the apparent stability of these figures. This data was then "blended" with S&P's existing composite index over another five year period (going back to January 1947), perhaps accounting for the transition period, with the previous composite index from that point earlier being left unchanged.
- Some combination of these scenarios.
Our gut feeling is that the first scenario is the correct one, but we can't rule out the second, primarily due to what appears to us to be unusual confluences in the dates involved. We suspect it's a coincidence, but we don't know enough about how the S&P 500 evolved in this period to authoritatively confirm if that is the case.
But then, that's what the blogosphere is for! Anyone?
Welcome to the blogosphere's toolchest! Here, unlike other blogs dedicated to analyzing current events, we create easy-to-use, simple tools to do the math related to them so you can get in on the action too! If you would like to learn more about these tools, or if you would like to contribute ideas to develop for this blog, please e-mail us at:
ironman at politicalcalculations
Thanks in advance!
Closing values for previous trading day.
This site is primarily powered by:
CSS Validation
RSS Site Feed
JavaScript
The tools on this site are built using JavaScript. If you would like to learn more, one of the best free resources on the web is available at W3Schools.com.