Every three months, we take a snapshot of the expectations for future earnings in the S&P 500 (Index: SPX) at approximately the midpoint of the current quarter, shortly after most U.S. firms have announced their previous quarter's earnings.
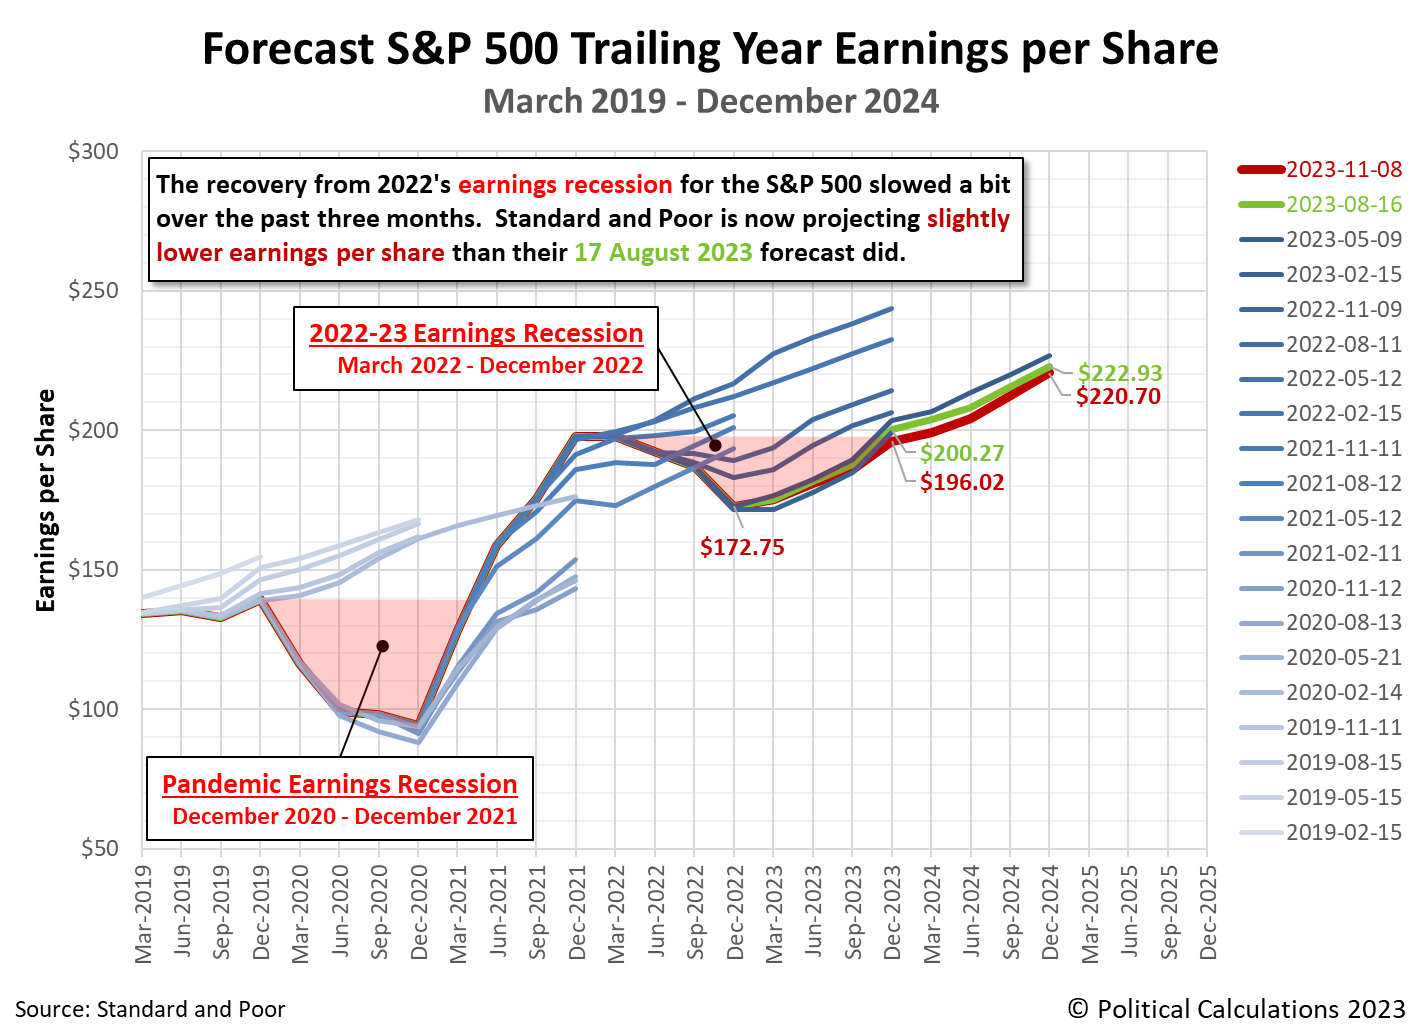
Since our last update three months ago, expectations for the S&P 500's earnings have dipped by a small amount. Expectations for the index' future earnings per share through the end of 2023 has decreased from $200.27 to $196.02.
That's almost enough to mark a full recovery from 2022's earnings recession in the fourth quarter of 2023. Given current projections, we believe that threshold will be properly crossed very early in 2024-Q1.
The following chart illustrates how the latest earnings outlook has changed with respect to previous snapshots:
Standard and Poor's projections through the end of 2024 indicates a smaller decline in thie index' earnings per share through that point of tme. They show the S&P 500's earnings per share decreasing from $222.93 to $220.70.
About Earnings Recessions
Depending on who you talk to, an earnings recession has one of two definitions. An earnings recession exists if either earnings decline over at least two consecutive quarters or if there is a year-over-year decline over at least two quarters. The chart identifies the periods in which the quarter-on-quarter decline in earnings definition for an earnings recession is confirmed for both the Pandemic Earnings Recession (December 2020-December 2021) and the new earnings recession (March 2022-December 2022) according to the first definition. The regions of the graph shaded in light-red correspond to the full period in which the S&P 500's earnings per share remained below (or are projected to remain below) its pre-earnings recession levels.
Using the slighly different measure of year-over-year growth rate, analysts at Raymond James are signaling the S&P 500's earnings recession is officially over. Here's the story from Markets Insider:
Our Chart of the Day is from Raymond James, which shows that the S&P 500's earnings recession has officially ended.
So far, 92% of S&P 500 companies have reported their third-quarter earnings results. Of those companies, 82% beat profit estimates by a median of 7%, while 59% beat sales estimates by a median of 3%, according to data from Fundstrat.
The results put the S&P 500 on track to see third-quarter year-over-year profit growth of 5%, which is well ahead of analysts estimates for flat growth just four months ago.
There is a difference in terminology for what Raymond James' analysts are describing with respect to what we are tracking. We follow Standard & Poor's example of identifying earnings according to the quarter in which they are reported, while Raymond James identifies them by the calendar quarter in which they occurred. What they identify as 2023-Q3 earnings is what we would identify as belonging to 2023-Q4.
That descriptive difference aside, Standard & Poor's earnings estimates as of 8 November 2023 put 2023-Q4's year-over-year earnings growth rate just ever-so-slightly below water. They are very much on track to record positive year-over-year growth in 2024-Q1.
Our next snapshot of the index' expected future earnings will be in three months.
Reference
Silverblatt, Howard. Standard & Poor. S&P 500 Earnings and Estimates. [Excel Spreadsheet]. 8 November 2023. Accessed 8 November 2023.
Labels: earnings, forecasting, SP 500
Welcome to the blogosphere's toolchest! Here, unlike other blogs dedicated to analyzing current events, we create easy-to-use, simple tools to do the math related to them so you can get in on the action too! If you would like to learn more about these tools, or if you would like to contribute ideas to develop for this blog, please e-mail us at:
ironman at politicalcalculations
Thanks in advance!
Closing values for previous trading day.
This site is primarily powered by:
CSS Validation
RSS Site Feed
JavaScript
The tools on this site are built using JavaScript. If you would like to learn more, one of the best free resources on the web is available at W3Schools.com.
