
Every three months, we take a snapshot of the expectations for future earnings in the S&P 500 (Index: SPX) at approximately the midpoint of the current quarter, shortly after most U.S. firms have announced their previous quarter's earnings.
Or we did, up until this month. The man behind the data we've visualized for this feature, Standard and Poor's Howard Silverblatt, retired on 31 January 2026 after 48 years, 8 months, 14 days at S&P!
Benedek Vörös, S&P Dow Jones' Index Investment Strategy Director, marked the career milestone just before Howard's final day on the job:
This week has given the markets plenty to digest. But for many of us at S&P Dow Jones Indices, the most significant data point isn't on the tape. It’s on the calendar. Tomorrow marks the final day of Howard Silverblatt’s legendary 49-year tenure at our firm. For five decades, Howard’s definitive voice tracked the ebb and flow of the world’s most prominent index with a precision that turned financial math into a narrative art form. Whether he was breaking down S&P 500®, buyback yields for the Wall Street Journal or explaining the compounding power of dividends on CNBC, Howard taught a generation of investors that while price is what you pay, the underlying cash flow is what you get.
We hope S&P continues regularly publishing the data series Howard routinely made freely available at the S&P 500's official home on the internet. Including the earnings expectations we're featuring in this article.
Although we pulled the data on 13 February 2026 and referenced that date in the following chart, our Winter 2026 snapshot was really taken on 31 January 2026 and has been pulled from Howard's final Earnings & Estimates spreadsheet, which he posted on his last day on the job! The following chart presents how earnings expectations have changed from the end of 2021 through the end of January 2026:

The earnings outlook has substantially improved since our Fall 2025 snapshot. Earnings for the final quarter of 2025 are still being reported, but the S&P 500's trailing year earnings per share rose from $244.51 to $246.47 per share. Looking further forward, the index' forecast trailing year earnings per share through the end of 2026 saw robust improvements, rising from $281.78 to $294.00 as the outlook for earnings improved.
It's quite an impressive earnings outlook to go out on. Howard Silverblatt picked his exit date well!
At this writing, we don't know S&P's plans regarding whether it will continue publishing this data series or others that Howard maintained, such as S&P's monthly Divstat data that continued a long tradition of publishing the U.S. stock market's dividend metadata that extends back to January 1929, when a young firm then known as Standard Statistics began the practice and made it available to the Associated Press! We hope they do, because that's a big part of what made the firm that became Standard & Poor a trusted source of information conveying how the stock market is performing over the years.
For the last 49 years of its history, Howard Silverblatt tracked and presented the market data that sustained that hard-earned trust. He's left behind some very big shoes to fill.
Reference
Silverblatt, Howard. Standard & Poor. S&P 500 Earnings and Estimates. [Excel Spreadsheet]. 31 January 2026. Accessed 13 February 2026. Over the years, this spreadsheet captured a lot of Howard's personality, occasionally featuring photos or other observations that made it stand apart from the dry presentation of financial data that's common in the finance industry.
Image Credit: Microsoft Copilot Designer. Prompt: "A crystal ball with the word 'SP 500' written inside it". And 'Earnings' written above it, which we added.
Labels: earnings, forecasting, SP 500


Every three months, we take a snapshot of the expectations for future earnings in the S&P 500 (Index: SPX) at approximately the midpoint of the current quarter, shortly after most U.S. firms have announced their previous quarter's earnings.
For Fall 2025, our snapshot was taken on 12 November 2025, 91 days after the Summer 2025 snapshot. The outlook for earnings improved since last quarter's snapshot, continuing a positive trend since Spring 2025.
The current projection for the S&P 500's earnings per share through the end of 2025 is $244.51, which would represent a 16.3% year-over-year gain over December 2024's finalized earnings of $210.17.
The following chart, covering how earnings expectations have changed from the end of 2021 through 12 November 2025:

Looking further forward through the end of 2026, Standard & Poor projects the S&P 500's earnings will be $281.78 per share. If this projection holds, it would represent a little over a 15% year-over-year increase over the current earnings projection for 2025.
But will it hold? There's a lot of time between now and the end of December 2026 and if there's one thing the chart makes clear, it's very unlikely the earnings recorded then will match what they were projected to be four quarters earlier!
Reference
Silverblatt, Howard. Standard & Poor. S&P 500 Earnings and Estimates. [Excel Spreadsheet]. 12 November 2025. Accessed 15 November 2025.
Image Credit: Microsoft Copilot Designer. Prompt: "A crystal ball with the word 'SP 500' written inside it". And 'Earnings' written above it, which we added.
Labels: earnings, forecasting, SP 500
Every three months, we take a snapshot of the expectations for future earnings in the S&P 500 (Index: SPX) at approximately the midpoint of the current quarter, shortly after most U.S. firms have announced their previous quarter's earnings.
The latest snapshot was snapped 96 days after the Spring 2025 snapshot. The outlook for earnings has improved since last quarter's snapshot, with slightly higher earnings expected in the remaining quarters of 2025 than what was anticipated three months ago.
In fact, it's probably better to describe the outlook for dividends as having stabilized over the past three months. Which itself is remarkable because the quarter has seen a revival in the fortunes of AI technology firms and multiple trade deals. Both changes are significant since much of the decline in the outlook for earnings came after the AI-bubble deflated and President Trump's "Liberation Day" tariff announcements, which both negatively affected earnings expectations for S&P 500 companies.
The following chart, covering how earnings expectations have changed from the end of 2021 through 13 August 2025:

The current projection for the S&P 500's earnings per share through the end of 2025 is $242.27, which would represent 15.3% year-over-year earnings growth over December 2024's finalized level of $210.17.
Looking further forward through the index' expected earnings per share through the end of 2026, Standard & Poor projects the S&P 500's earnings per share will be $277.12, which would represent year-over-year earnings growth of 14.4% above the current projection for the index' December 2025 earnings per share.
Reference
Silverblatt, Howard. Standard & Poor. S&P 500 Earnings and Estimates. [Excel Spreadsheet]. 13 August 2025. Accessed 15 August 2025.
Image Credit: Microsoft Copilot Designer. Prompt: "A crystal ball with the word 'SP 500' written inside it". And 'Earnings' written above it, which we added.
Every three months, we take a snapshot of the expectations for future earnings in the S&P 500 (Index: SPX) at approximately the midpoint of the current quarter, shortly after most U.S. firms have announced their previous quarter's earnings.
The latest snapshot comes 87 days after the Winter 2025 snapshot. Since that snapshot, the outlook for earnings has dimmed, with significantly lower growth anticipated in the quarters ahead.
The change over the past three months is larger than the typical pattern that earnings forecasts follow. Here, expectations for future earnings tend to erode with each later snapshot, usually by relatively small amounts from quarter to quarter. It is unusual for the earnings forecast to improve from snapshot to snapshot.
Two major events have occurred during the last three months that have knocked the earnings forecast lower. First, a deflation phase for the AI-bubble got underway, starting on 21 February 2025 when the company behind China's DeepSeek Artificial Intelligence (AI) system announced they would make its code open source. That serious new competition put a cap on the potential earnings of the "Big Tech" firms making big AI-related investments.
Second, President Trump's 'Liberation Day' tariff announcement after the market closed on 2 April 2025 knocked the earnings outlook for many other firms lower, at least through the time of this snapshot. This snapshot only captures a little over a week's worth of the recent surge of deal-making momentum that's driven stock prices higher in recent weeks.
Of the two events, the deflation of the AI-bubble has been the bigger force shaping future earnings expectations.
The following chart, covering how earnings expectations have changed from the end of 2021 through 9 May 2025:

The current projection for the S&P 500's earnings per share through the end of 2025 is $241.33, which would represent 14.8% year-over-year earnings growth over December 2024's finalized level of $210.17.
Looking further forward through the index' expected earnings per share through the end of 2026, Standard & Poor projects the S&P 500's earnings per share will be $276.88, down 4.4% from its initial estimate of $289.64 per share.
Reference
Silverblatt, Howard. Standard & Poor. S&P 500 Earnings and Estimates. [Excel Spreadsheet]. 9 May 2025. Accessed 16 May 2025.
Image Credit: Microsoft Copilot Designer. Prompt: "A crystal ball with the word 'SP 500' written inside it". And 'Earnings' written above it, which we added.
Labels: earnings, forecasting
Every three months, we take a snapshot of the expectations for future earnings in the S&P 500 (Index: SPX) at approximately the midpoint of the current quarter, shortly after most U.S. firms have announced their previous quarter's earnings.
The latest snapshot is a little early, but still 90 days since the Fall 2024 snapshot. During this time, remarkably little changed in the outlook for the collective earnings of the companies that make up the S&P 500 index. That relative lack of change is a new development that's taken place over the past six months.
That's remarkable because it runs counter to the pattern we typically see in how the outlook for earnings changes with time. That pattern is one in which the expectations for future earnings tend to erode with each later snapshot.
To be sure, that pattern holds in the Winter 2025 snapshot but the amount of erosion is tiny. Looking at the S&P 500's anticipated earnings per share for the end of the fourth quarter of 2025, we find those expectations dipped by $1.49 per share. That's a decline of just 0.6%.
The following chart, covering how earnings expectations have changed from the end of 2021 through 11 February 2025 illustrates both the typical pattern and the relative lack of change in those expectations since 13 August 2024:

The current projection for the S&P 500's earnings per share through the end of 2025 is $249.13, which would represent 18.2% year-over-year earnings growth over December 2024's level of $210.81. Given the typical pattern for how earnings projections develop over time, that figure represents the likely ceiling for potential earnings growth during 2025.
The Winter 2025 snapshot also includes the first projection of the index' expected earnings per share through the end of 2026. The first estimate of what those earnings will be is $289.64 per share.
Reference
Silverblatt, Howard. Standard & Poor. S&P 500 Earnings and Estimates. [Excel Spreadsheet]. 13 November 2024. Accessed 17 February 2025.
Image Credit: Microsoft Copilot Designer. Prompt: "A crystal ball with the word 'SP 500' written inside it". And 'Earnings' written above it, which we added.
Labels: earnings, forecasting, SP 500
Every three months, we take a snapshot of the expectations for future earnings in the S&P 500 (Index: SPX) at approximately the midpoint of the current quarter, shortly after most U.S. firms have announced their previous quarter's earnings.
The index' earnings per share show little change with respect to where they were just three months earlier. We find some minor erosion in 2024-Q4's projected earnings, which dipped from $216.65 per share on 13 August 2024 to $211.67 per share on 13 November 2024.
Meanwhile, there's virtually no meaningful change in Standard and Poor's projections of the S&P 500's earnings per share at the end of 2025-Q4. Here, we see S&P's forecast dipped by a trivial 25 cents per share, from $250.87 in mid-August 2024 to $250.62 in mid-November 2024.
These developments are shown on the following chart:

At this point, we'll observe that it's changes in the outlook for dividends per share, rather than earnings per share, that primarily drives stock prices. The last three months have been characterized by the S&P 500 rising to new record highs, though there has been very little-to-negative changes in its earnings per share outlook. We'll present how the outlook for the S&P 500's dividends per share in the very near future.
Reference
Silverblatt, Howard. Standard & Poor. S&P 500 Earnings and Estimates. [Excel Spreadsheet]. 13 November 2024. Accessed 1 November 2024.
Image Credit: Microsoft Copilot Designer. Prompt: "A crystal ball with the word 'SP 500' written inside it". And 'Earnings' written above it, which we added.
Labels: earnings, forecasting, SP 500
Every three months, we take a snapshot of the expectations for future earnings in the S&P 500 (Index: SPX) at approximately the midpoint of the current quarter, shortly after most U.S. firms have announced their previous quarter's earnings.
The recovery from 2022's earnings recession for the S&P 500 is now complete with the index' earnings per share in June 2024 finally rising above its pre-recession peak recorded back in March 2022. Earnings per share in the S&P 500 had fallen by 12.7% from March 2022 to December 2022 before their slow and uneven recovery over the following eighteen months.
By contrast, the recovery from 2020's Coronavirus Pandemic Recession was much quicker, with the index taking less than two quarters to fully regain the earnings per share it lost after the government mandated lockdowns that shuttered economic activity were lifted.
Looking forward to the ends of 2024 and 2025 respectively, Standard and Poor is now projecting slightly lower earnings per share for the S&P 500 than they had in their 14 May 2024 forecast. S&P's projected earnings per share for December 2024 is $216.65 per share, while December 2025's earnings per share are now anticipated to come in at $250.87 per share.
All these developments are shown on the following chart:

If we include the near-zero rate of earnings per share growth the S&P 500 saw from December 2021 to March 2022, the S&P 500's earnings recession fully overlaps the two quarters of negative real GDP growth the U.S. economy went through in the first half of 2022 as inflation unleashed by the Biden-Harris administration raged out of control. As it was, the earnings of the companies that make up the S&P 500 index had enough positive momentum coming out of 2021 to record a positive gain in the first quarter of 2022 of just four cents per share over the previous quarter's level, which is why it narrowly avoids being included in the earnings recession.
Reference
Silverblatt, Howard. Standard & Poor. S&P 500 Earnings and Estimates. [Excel Spreadsheet]. 13 August 2024. Accessed 17 August 2024.
Image Credit: Microsoft Copilot Designer. Prompt: "A crystal ball with the word 'SP 500' written inside it". And 'Earnings' written above it, which we added.
Labels: earnings, forecasting, SP 500
Every three months, we take a snapshot of the expectations for future earnings in the S&P 500 (Index: SPX) at approximately the midpoint of the current quarter, shortly after most U.S. firms have announced their previous quarter's earnings.
Since our last update three months ago, expectations for the S&P 500's earnings have improved. The S&P 500's earnings per share had been expected to return to their March 2022 peak of $197.91 after June 2024, but now looks like it will hit that mark before the end of 2024-Q2.
Here is a summary of the major observations that may be seen in the changes of Standard & Poor's earnings projections from 14 February 2024 to 14 May 2024:
- Earnings per share for 2023-Q4 increased from a projection of $189.74 to a finalized figure of $192.43.
- Projected earnings for 2024-Q1 improved from $190.54 to $192.93 per share.
- S&P projects faster earnings growth during the second half of 2024, improving from $217.99 to $218.13 per share by the end of the year.
- The first projection of where the S&P 500's earnings per share will be at the end of 2025 is $251.91.
The following chart reveals how the latest earnings outlook has changed with respect to previous snapshots:
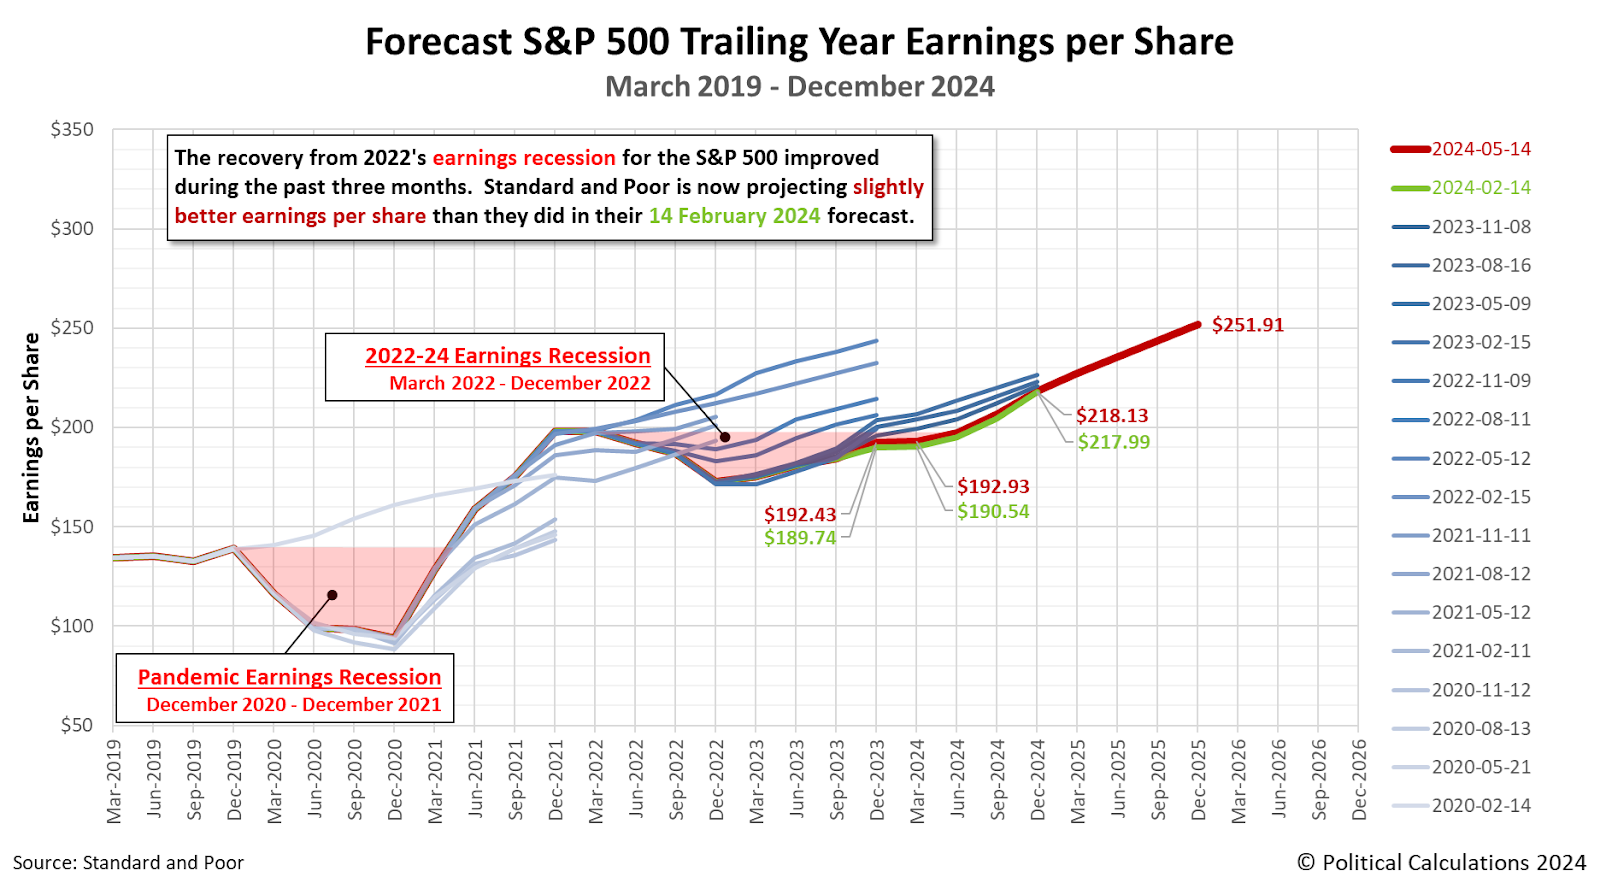
If you look at the historic earnings expectations shown on the chart, particularly the period since 2021, you'll notice a negative pattern in which later projections for earnings are less optimistic than the projections that preceeded them. This is the 'typical' pattern we see in these earnings projections.
About Earnings Recessions
Depending on who you talk to, an earnings recession has one of two definitions. An earnings recession exists if either earnings decline over at least two consecutive quarters or if there is a year-over-year decline over at least two quarters. The chart identifies the periods in which the quarter-on-quarter decline in earnings definition for an earnings recession is confirmed for both the Pandemic Earnings Recession (December 2020-December 2021) and the new earnings recession (March 2022-December 2022) according to the first definition. The regions of the graph shaded in light-red correspond to the full period in which the S&P 500's earnings per share remained below (or are projected to remain below) its pre-earnings recession levels.
Let's define what a "double-dip" earnings recession would be in case that becomes relevant at the time of our next update. This term describes the situation where after having begun to recover, the S&P 500's earnings per share stops rising and falls without having recovered to its pre-earnings recession level.
Our next snapshot of the index' expected future earnings will be in three months. With the improvement in the earnings outlook over the past three months, we should be able to confirm the full recovery from 2022's earnings recession. Then again, at the end of 2023, we didn't expect that recovery would stretch out as it has, so there is the possibility things will turn to be more negative.
Reference
Silverblatt, Howard. Standard & Poor. S&P 500 Earnings and Estimates. [Excel Spreadsheet]. 14 May 2024. Accessed 15 May 2024.
Image Credit: Microsoft Copilot Designer. Prompt: "A crystal ball with the word 'SP 500' written inside it". And 'Earnings' written above it, which we added.
Labels: earnings, forecasting, SP 500

Every three months, we take a snapshot of the expectations for future earnings in the S&P 500 (Index: SPX) at approximately the midpoint of the current quarter, shortly after most U.S. firms have announced their previous quarter's earnings.
Since our last update three months ago, expectations for the S&P 500's earnings slumped in the near term and are stretching out the recovery from 2022's earnings recession. The S&P 500's earnings per share had been expected to return to their March 2022 peak of $197.91 during the first quarter of 2024, but that full recovery now looks to be delayed until after June 2024.
The following chart reveals how the latest earnings outlook has changed with respect to previous snapshots:

Here is a summary of the major observations that may be seen in the changes of Standard & Poor's earnings projections from 8 November 2023 to 14 February 2024:
- Earnings for 2023-Q4 decreased from a projection of $196.02 to $189.74. These earnings are still being reported, so this value is not yet final.
- Projected earnings for 2024-Q1 dropped from $199.17 to $190.54. This change suggests near-zero earnings growth during the first quarter of 2024.
- S&P projects faster earnings growth during the second half of 2024.
- Despite that faster anticipated growth, the S&P 500's earnings per share is still expected to dip from $220.70 to $217.99 at the end of 2024.
If you look at the historic earnings expectations shown on the chart, particularly the period since 2021, you'll notice a negative pattern in which later projections for earnings are less optimistic than the projections that preceeded them. With 2024-Q1's anticipated earnings per share looking to be nearly unchanged from 2023-Q4's level, should that pattern hold, our spring update may show the start of a "double-dip" earnings recession for the S&P 500.
About Earnings Recessions
Depending on who you talk to, an earnings recession has one of two definitions. An earnings recession exists if either earnings decline over at least two consecutive quarters or if there is a year-over-year decline over at least two quarters. The chart identifies the periods in which the quarter-on-quarter decline in earnings definition for an earnings recession is confirmed for both the Pandemic Earnings Recession (December 2020-December 2021) and the new earnings recession (March 2022-December 2022) according to the first definition. The regions of the graph shaded in light-red correspond to the full period in which the S&P 500's earnings per share remained below (or are projected to remain below) its pre-earnings recession levels.
Let's define what a "double-dip" earnings recession would be in case that becomes relevant at the time of our next update. This term describes the situation where after having begun to recover, the S&P 500's earnings per share stops rising and falls without having recovered to its pre-earnings recession level.
Our next snapshot of the index' expected future earnings will be in three months.
Reference
Silverblatt, Howard. Standard & Poor. S&P 500 Earnings and Estimates. [Excel Spreadsheet]. 14 February 2024. Accessed 17 February 2024.
Image credit: Stable Diffusion DreamStudio Beta. Prompts: "The word 'EARNINGS' and "The word 'Recession'". We combined the two AI-generated images to produce the "Earnings Recession" graphic.
Every three months, we take a snapshot of the expectations for future earnings in the S&P 500 (Index: SPX) at approximately the midpoint of the current quarter, shortly after most U.S. firms have announced their previous quarter's earnings.
Since our last update three months ago, expectations for the S&P 500's earnings have dipped by a small amount. Expectations for the index' future earnings per share through the end of 2023 has decreased from $200.27 to $196.02.
That's almost enough to mark a full recovery from 2022's earnings recession in the fourth quarter of 2023. Given current projections, we believe that threshold will be properly crossed very early in 2024-Q1.
The following chart illustrates how the latest earnings outlook has changed with respect to previous snapshots:
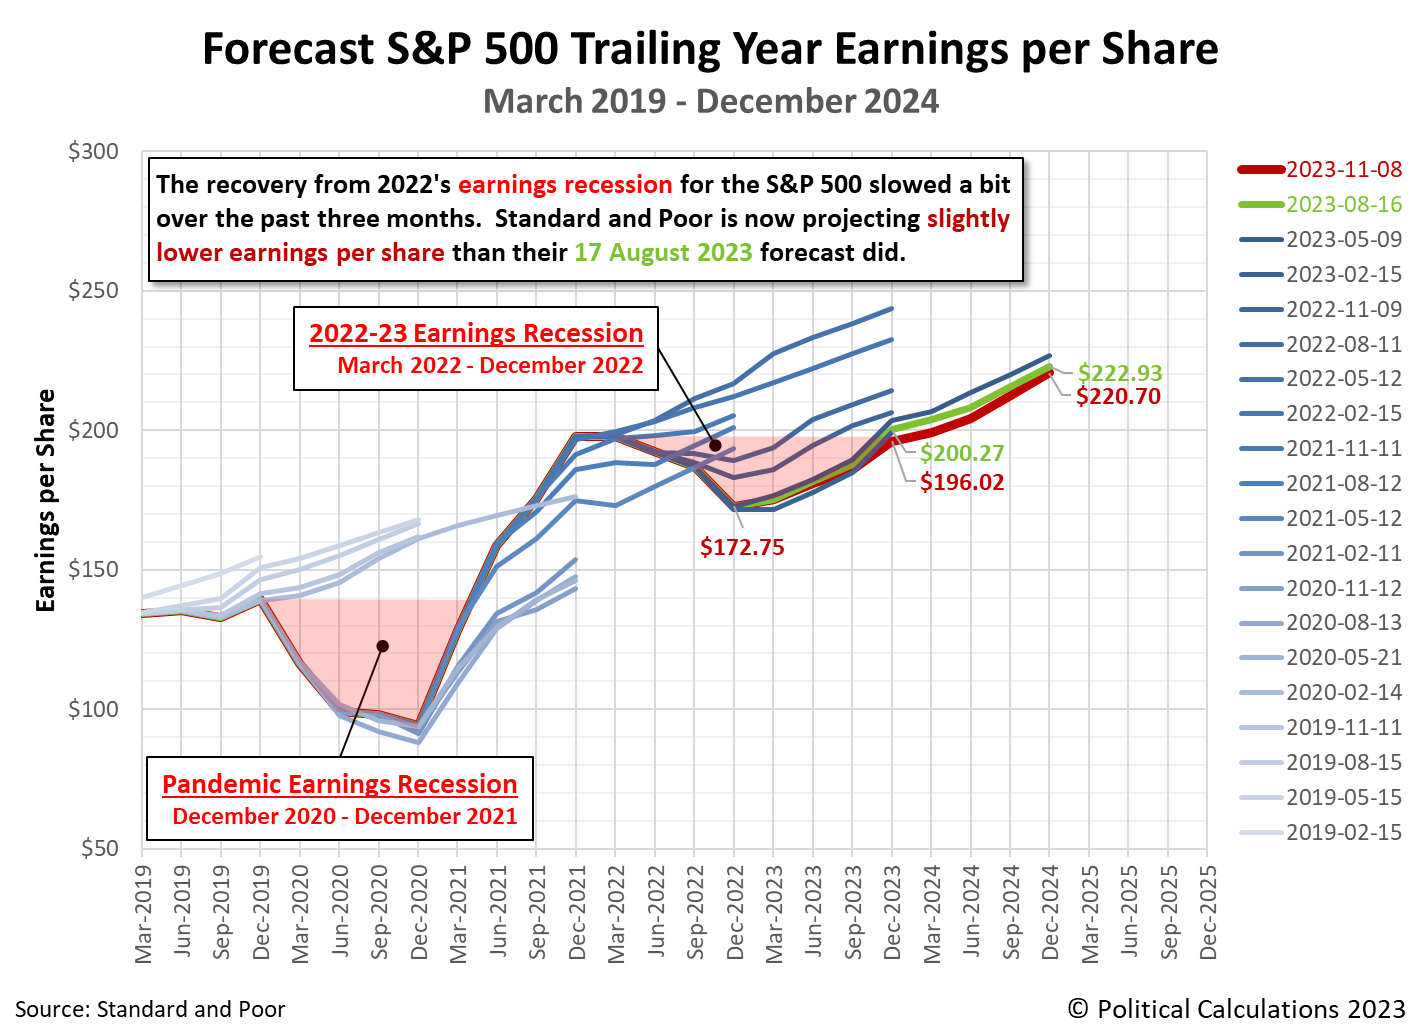
Standard and Poor's projections through the end of 2024 indicates a smaller decline in thie index' earnings per share through that point of tme. They show the S&P 500's earnings per share decreasing from $222.93 to $220.70.
About Earnings Recessions
Depending on who you talk to, an earnings recession has one of two definitions. An earnings recession exists if either earnings decline over at least two consecutive quarters or if there is a year-over-year decline over at least two quarters. The chart identifies the periods in which the quarter-on-quarter decline in earnings definition for an earnings recession is confirmed for both the Pandemic Earnings Recession (December 2020-December 2021) and the new earnings recession (March 2022-December 2022) according to the first definition. The regions of the graph shaded in light-red correspond to the full period in which the S&P 500's earnings per share remained below (or are projected to remain below) its pre-earnings recession levels.
Using the slighly different measure of year-over-year growth rate, analysts at Raymond James are signaling the S&P 500's earnings recession is officially over. Here's the story from Markets Insider:
Our Chart of the Day is from Raymond James, which shows that the S&P 500's earnings recession has officially ended.
So far, 92% of S&P 500 companies have reported their third-quarter earnings results. Of those companies, 82% beat profit estimates by a median of 7%, while 59% beat sales estimates by a median of 3%, according to data from Fundstrat.
The results put the S&P 500 on track to see third-quarter year-over-year profit growth of 5%, which is well ahead of analysts estimates for flat growth just four months ago.
There is a difference in terminology for what Raymond James' analysts are describing with respect to what we are tracking. We follow Standard & Poor's example of identifying earnings according to the quarter in which they are reported, while Raymond James identifies them by the calendar quarter in which they occurred. What they identify as 2023-Q3 earnings is what we would identify as belonging to 2023-Q4.
That descriptive difference aside, Standard & Poor's earnings estimates as of 8 November 2023 put 2023-Q4's year-over-year earnings growth rate just ever-so-slightly below water. They are very much on track to record positive year-over-year growth in 2024-Q1.
Our next snapshot of the index' expected future earnings will be in three months.
Reference
Silverblatt, Howard. Standard & Poor. S&P 500 Earnings and Estimates. [Excel Spreadsheet]. 8 November 2023. Accessed 8 November 2023.
Labels: earnings, forecasting, SP 500
Every three months, we take a snapshot of the expectations for future earnings in the S&P 500 (Index: SPX) at approximately the midpoint of the current quarter, shortly after most U.S. firms have announced their previous quarter's earnings.
Since our last update three months ago, expectations for the S&P 500's earnings have dimmed slightly. Expectations for the index' future earnings per share through the end of 2023 has decreased from $203.50 to $200.27.
Never-the-less, that's still high enough to indicate a full recovery from 2022's earnings recession is still on track for the fourth quarter of 2023.
The following chart illustrates how the latest earnings outlook has changed with respect to previous snapshots:
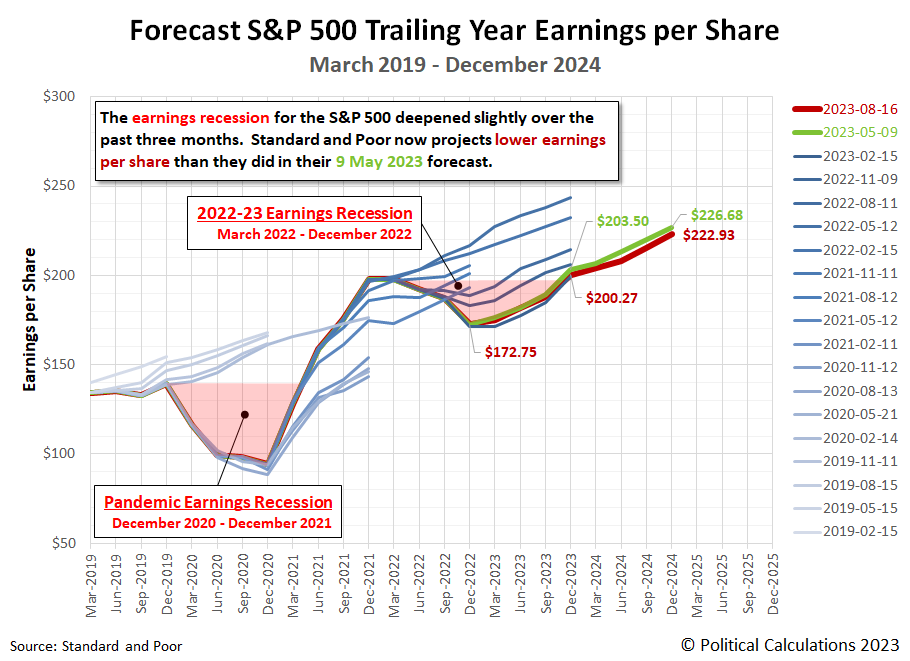
Standard and Poor's projections through the end of 2024 also showed a small decline in thie index' earnings per share. They show the S&P 500's earnings per share decreasing to $222.93 from the $226.88 expected three months ago.
About Earnings Recessions
Depending on who you talk to, an earnings recession has one of two definitions. An earnings recession exists if either earnings decline over at least two consecutive quarters or if there is a year-over-year decline over at least two quarters. The chart identifies the periods in which the quarter-on-quarter decline in earnings definition for an earnings recession is confirmed for both the Pandemic Earnings Recession (December 2020-December 2021) and the new earnings recession (March 2022-December 2022) according to the first definition. The regions of the graph shaded in light-red correspond to the full period in which the S&P 500's earnings per share remained below (or are projected to remain below) its pre-earnings recession levels.
Our next snapshot of the index' expected future earnings will be in three months.
Reference
Silverblatt, Howard. Standard & Poor. S&P 500 Earnings and Estimates. [Excel Spreadsheet]. 16 August 2023. Accessed 16 August 2023.
Labels: earnings, forecasting, SP 500

Every three months, we take a snapshot of the expectations for future earnings in the S&P 500 (Index: SPX) at approximately the midpoint of the current quarter, shortly after most U.S. firms have announced their previous quarter's earnings.
Since our last update three months ago, expectations for the S&P 500's has improved. The change reverses the negative pattern where earnings expectations have worsened at each of our snapshots since May 2022.
That negative pattern coincides with the onset of an earnings recession for the S&P 500, which became slightly shallower than previously projected over the previous three months. The bottom for that earnings recession is still December 2022, which rose to $172.75 per share from an estimated $171.52 in our Winter 2022 snapshot.
Looking forward to the end of 2023, expectations for the index' future earnings per share has increased from $199.28 to $203.50. Earnings at that level would correspond to a full recovery to the level of earnings recorded in March 2022, which marks the beginning of the S&P 500's earnings recession.
The following chart illustrates how the latest earnings outlook has changed with respect to previous snapshots:
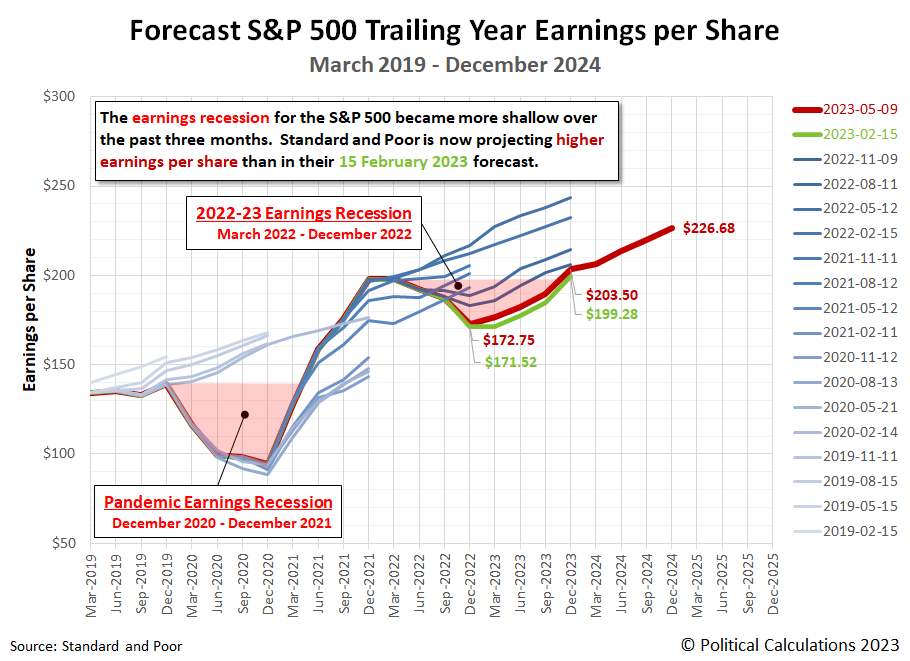
Standard and Poor's projections also provide a first look at the level of earnings anticipated at the end of 2024. They show the S&P 500's earnings per share increasing to $226.88.
About Earnings Recessions
Depending on who you talk to, an earnings recession has one of two definitions. An earnings recession exists if either earnings decline over at least two consecutive quarters or if there is a year-over-year decline over at least two quarters. The chart identifies the periods in which the quarter-on-quarter decline in earnings definition for an earnings recession is confirmed for both the Pandemic Earnings Recession (December 2020-December 2021) and the new earnings recession (March 2022-December 2022) according to the first definition. The regions of the graph shaded in light-red correspond to the full period in which the S&P 500's earnings per share remained below (or are projected to remain below) its pre-earnings recession levels.
Our next snapshot of the index' expected future earnings will be in three months.
Reference
Silverblatt, Howard. Standard & Poor. S&P 500 Earnings and Estimates. [Excel Spreadsheet]. 9 May 2023. Accessed 9 May 2023.
Image credit: Photo by Sushobhan Badhai on Unsplash.
Labels: earnings, forecasting, SP 500

Every three months, we take a snapshot of the expectations for future earnings in the S&P 500 (Index: SPX) at approximately the midpoint of the current quarter, shortly after most U.S. firms have announced their previous quarter's earnings.
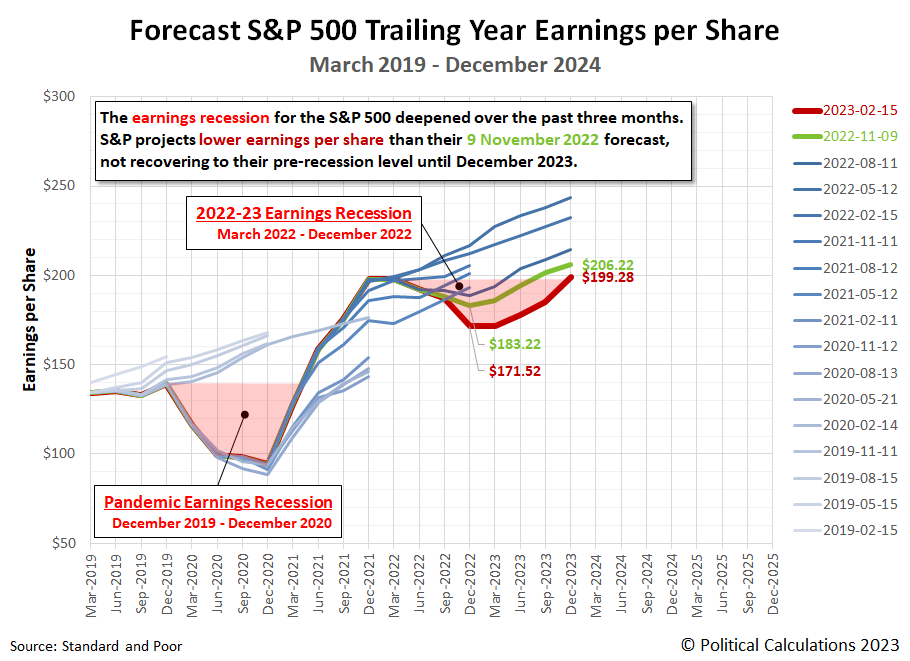
Since our last update three months ago, the S&P 500's earnings recession deepened and lengthened again. The bottom dropped to at least $171.52 earnings per share, down from the $183.22 projected during our Fall 2022 snapshot. Looking further forward, to the end of 2023, expectations for the S&P 500's earnings also declined, but by a smaller amount. The S&P 500's earnings at the end of December 2023 are now expected to be $199.28 per share, down from $206.22 per share.
At the same time, Standard and Poor projects the new earnings recession will not recover to its pre-earnings recession level until December 2023. The following chart illustrates how the latest earnings outlook has changed with respect to previous snapshots:
About Earnings Recessions
Depending on who you talk to, an earnings recession has one of two definitions. An earnings recession exists if either earnings decline over at least two consecutive quarters or if there is a year-over-year decline over at least two quarters. The chart identifies the periods in which the quarter-on-quarter decline in earnings definition for an earnings recession is confirmed for both the Pandemic Earnings Recession (December 2020-December 2021) and the new earnings recession (March 2022-December 2022) according to the first definition. The regions of the graph shaded in light-red correspond to the full period in which the S&P 500's earnings per share remained below (or are projected to remain below) its pre-earnings recession levels.
Our next snapshot of the index' expected future earnings will be in three months, where it is quite possible the bottom for the 2022-23 earnings recession will shift to the first quarter of 2023.
Reference
Silverblatt, Howard. Standard & Poor. S&P 500 Earnings and Estimates. [Excel Spreadsheet]. 15 February 2023. Accessed 17 February 2023.
Labels: earnings, recession, SP 500
Every three months, we take a snapshot of the expectations for future earnings in the S&P 500 (Index: SPX) at approximately the midpoint of the current quarter, shortly after most U.S. firms have announced their previous quarter's earnings.
The S&P 500's earnings recession has deepened since since our last update three months ago. Standard and Poor continues to project the new earnings recession will last through at least December 2022. The following chart illustrates how the latest earnings outlook has changed with respect to previous snapshots:

Depending on who you talk to, an earnings recession has one of two definitions. An earnings recession exists if either earnings decline over at least two consecutive quarters or if there is a year-over-year decline over at least two quarters. The chart identifies the periods in which the quarter-on-quarter decline in earnings definition for an earnings recession is confirmed for both the Pandemic Earnings Recession (December 2020-December 2021) and the new earnings recession (March 2022-December 2022). The regions of the chart we've shaded in light red indicate the periods where year-over-year declines in earnings per share to qualify as an earnings recession would be satisfied.
Our next snapshot of the index' expected future earnings will be in three months. Whether the S&P 500's current earnings recession extends into 2023 will be determined during that time.
Reference
Silverblatt, Howard. Standard & Poor. S&P 500 Earnings and Estimates. [Excel Spreadsheet]. 9 November 2022. Accessed 11 November 2022.
Labels: earnings, recession, SP 500
Every three months, we take a snapshot of the expectations for future earnings in the S&P 500 (Index: SPX) at approximately the midpoint of the current quarter, shortly after most U.S. firms have announced their previous quarter's earnings.
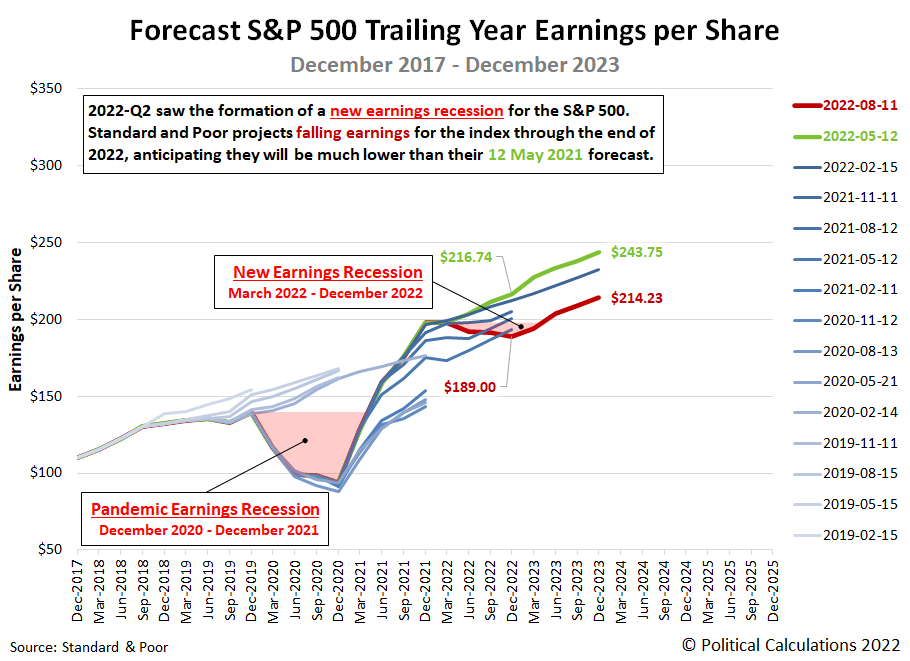
The outlook for S&P 500 earnings has deteriorated since since our last update three months ago. Standard and Poor now projects a new earnings recession, lasting through December 2022. The following chart illustrates how the latest earnings outlook has changed with respect to previous snapshots:
Unlike the semantic games played by pedantic douchebags over the accepted definition of a recession for the U.S. economy, an earnings recession has a simple definition:
“Earnings recession” is usually interpreted as two consecutive quarters of decline. In the case of the market, that would mean that corporate earnings dropped for two quarters in a row.
There is a minor dispute over whether that means consecutive quarter-on-quarter declines or if it means consecutive declines over two quarters with respect to the same quarters a year earlier. However, that dispute is moot in this case. The updated outlook for the S&P 500's reported earnings qualifies as an earnings recession under both these interpretations.
In the chart, we've identified the period in which the quarter-on-quarter decline in earnings interpretation was met by both the Pandemic Earnings Recession (December 2020-December 2021) and the projected new earnings recession (March 2022-December 2022). The regions of the chart we've shaded in light red indicate the periods where the year-over-year interpretation of an earnings recession is met.
Whether the S&P 500's earnings per share actually experiences an earnings recession through the rest of 2022 now depends entirely on the earnings reports of the index' 505 component firms over the months ahead. Our next snapshot of the index' expected future earnings will be in three months.
Reference
Silverblatt, Howard. Standard & Poor. S&P 500 Earnings and Estimates. [Excel Spreadsheet]. 11 August 2022. Accessed 12 August 2022.
Labels: earnings, recession forecast, SP 500
Every three months, we take a snapshot of the expectations for future earnings in the S&P 500 (Index: SPX) at approximately the midpoint of the current quarter, shortly after most U.S. firms have announced their previous quarter's earnings.
Since our last update three months ago, Standard and Poor's projections have strengthened, indicating expectations of stronger growth through 2022 and 2023. The following chart illustrates how the earnings outlook has changed with respect to previous snapshots:
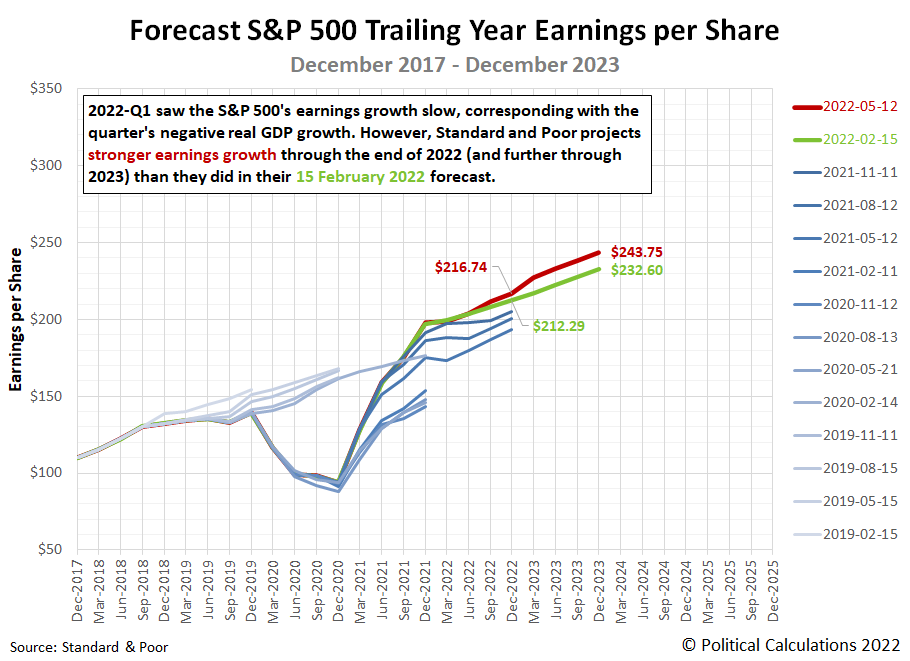
The improved outlook for S&P 500 earnings has developed even though the Federal Reserve has begun raising interest rates and is signaling larger rate hikes to squelch excess inflation generated by the Biden-Harris administration's fiscal policies. Since those policies represent a growing headwind for the U.S. economy, it raises the question of how much more improvement would have been seen had the Fed chosen to continue holding the Federal Funds Rate at the zero bound.
Reference
Silverblatt, Howard. Standard & Poor. S&P 500 Earnings and Estimates. [Excel Spreadsheet]. 12 May 2022. Accessed 13 May 2022.
Labels: earnings, forecasting, SP 500
With over 95% of the earnings data for the fourth quarter of 2021 now reported, we thought it might be a good time to visualize the historic yields for the S&P 500 (Index: SPX). The following chart presents the trailing year earnings and dividend yields for the index over the past 150 years, from January 1871 through December 2021.

For December 2021, we find the earnings yield for the S&P 500 is 4.70%, which places it within the middle of the range it has fallen during the past thirty years. The index' dividend yield however is 1.46%, which comes within a few tenths of a percent from its all-time low recorded at the peak of the Dot-Com Bubble in August 2000.
At this point in 2022, both measures of the relative valuation of the S&P 500 have risen as the value of the index has fallen throughout the year to date.
Labels: data visualization, dividends, earnings, SP 500, stock market
Every three months, we take a snapshot of the expectations for future earnings in the S&P 500 (Index: SPX) at approximately the midpoint of the current quarter, shortly after most U.S. firms have announced their previous quarter's earnings.
Since our last update three months ago, Standard and Poor modified their projections to indicate slightly stronger earnings growth through 2022 and steady earnings growth through the end of 2023.
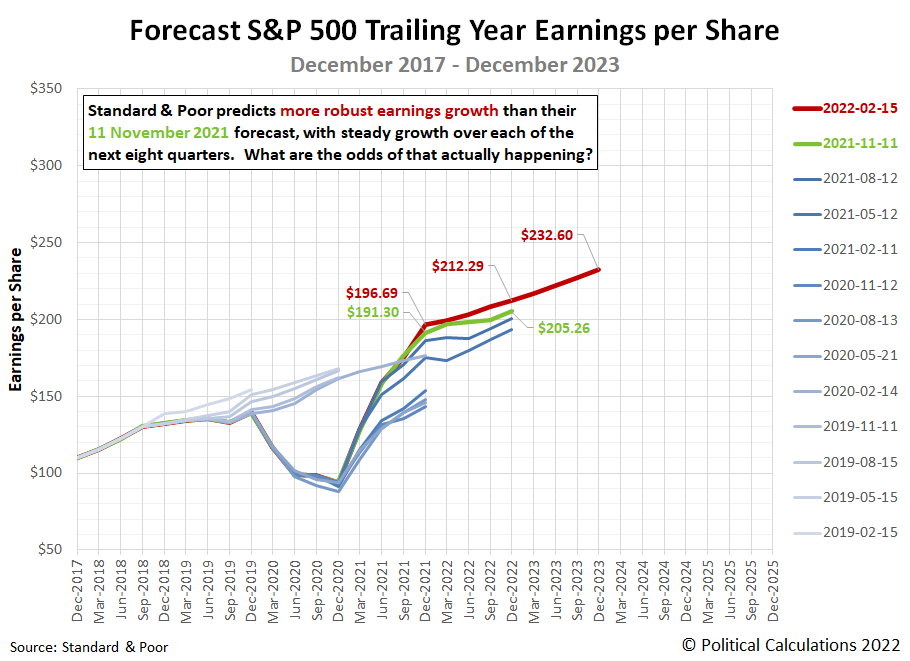
2021 was highly unusual for its improving expectations for future earnings at each of our previous snapshots for the year. That improvement was possible because of the recovery from the coronavirus pandemic recession, which was largely dictated by the lifting of lockdown measures imposed by state and local governments. With most of those remaining measures soon to expire, that source of improvement for the business outlook of S&P 500 companies will evaporate in the first half of 2022.
Worse, it is being replaced by an economic environment in which the Federal Reserve will be raising interest rates to quelch excess inflation generated by the Biden-Harris administration's fiscal policies. Which is to say the latest earnings projections indicating steady earnings growth for the S&P 500 may be optimistic because the companies that compose the S&P 500 can expect new headwinds.
Reference
Silverblatt, Howard. Standard & Poor. S&P 500 Earnings and Estimates. [Excel Spreadsheet]. 15 February 2022. Accessed 18 February 2022.
Every three months, we take a snapshot of the expectations for future earnings in the S&P 500 (Index: SPX) at approximately the midpoint of the current quarter, shortly after most U.S. firms have announced their previous quarter's earnings.
Since our last update three months ago, Standard and Poor has updated their projections to indicate stronger earnings growth going into 2022.

S&P is also forecasting slower earnings growth during 2022.
Reference
Silverblatt, Howard. Standard & Poor. S&P 500 Earnings and Estimates. [Excel Spreadsheet]. 11 November 2021. Accessed 12 November 2021.
Labels: earnings, forecasting, SP 500
Every three months, we take a snapshot of the expectations for future earnings in the S&P 500 (Index: SPX) at approximately the midpoint of the current quarter, shortly after most U.S. firms have announced their previous quarter's earnings.
The biggest change since our last update three months ago is that Standard and Poor's latest forecast is projecting stronger earnings growth.

The more robust earnings growth can best be seen in the trailing year earnings per share projected for December 2021. Three months ago, S&P anticipated that figure would be $174.87 per share (shown in green), which is now expected to reach $186.09 per share (red).
If that outcome is realized, it would put the S&P 500's trailing twelve month earnings per share ahead of the trajectory that S&P projected back in February 2020 (orange), before the onset of the coronavirus pandemic recession hammered corporate earnings in the U.S.
Reference
Silverblatt, Howard. Standard & Poor. S&P 500 Earnings and Estimates. [Excel Spreadsheet]. 12 August 2021. Accessed 12 August 2021.
Welcome to the blogosphere's toolchest! Here, unlike other blogs dedicated to analyzing current events, we create easy-to-use, simple tools to do the math related to them so you can get in on the action too! If you would like to learn more about these tools, or if you would like to contribute ideas to develop for this blog, please e-mail us at:
ironman at politicalcalculations
Thanks in advance!
Closing values for previous trading day.
This site is primarily powered by:

CSS Validation

RSS Site Feed

JavaScript
The tools on this site are built using JavaScript. If you would like to learn more, one of the best free resources on the web is available at W3Schools.com.
Other Cool Resources
Blog Roll


