When astronomer Urbain Le Verrier worked out the math to successfully predict where the planet Neptune would be discovered in the night sky back in 1846, he was really solving an inverse problem. By that, he used the observations that had been recorded about Uranus' position in its orbit to infer how that orbit might have been affected by what was then a hypothetical eighth planet in the solar system, and where it would have to be to create the observed effects.
Where that applies to the S&P 500 today lies in the fact that for whatever reason, our primary source for the dividend futures data that we use to forecast where stock prices will go is presently only showing them through December 2010. While that's something that's we've been carping about for months, we've been able to largely work around that limitation since investors have largely focused on the near term, where the available data combined with our mathematical model of how stock prices work have been sufficient to either hit or get close to the target.
 Our model is based on the premise that changes in the expected future growth rate of the S&P 500's dividends per share are what primarily drive changes in the growth rate of stock prices. We can observe this by plotting the change in the growth rates for both dividends per share and stock prices over time.
What we've found is that we can directly match a change in the expected growth rate of dividends at specific points in the future to how stock prices change today within a relatively small margin of error. Mathematically, all we need to do to account for that effect is to multiply the change in the expected growth rate of dividends per share by a simple scale factor (which we've found to typically range between 6.5 and 11.0) and to shift the future dividend data backward in time to coincide with the present.
Since December 2008, when we first discovered this relationship, we have observed that changes in the growth rate of stock prices have either directly coincided with the expected change in the expected growth rate of dividends per share at specific points in the future or have been in transition between two specific points in the future.
Until April 2010, that is!
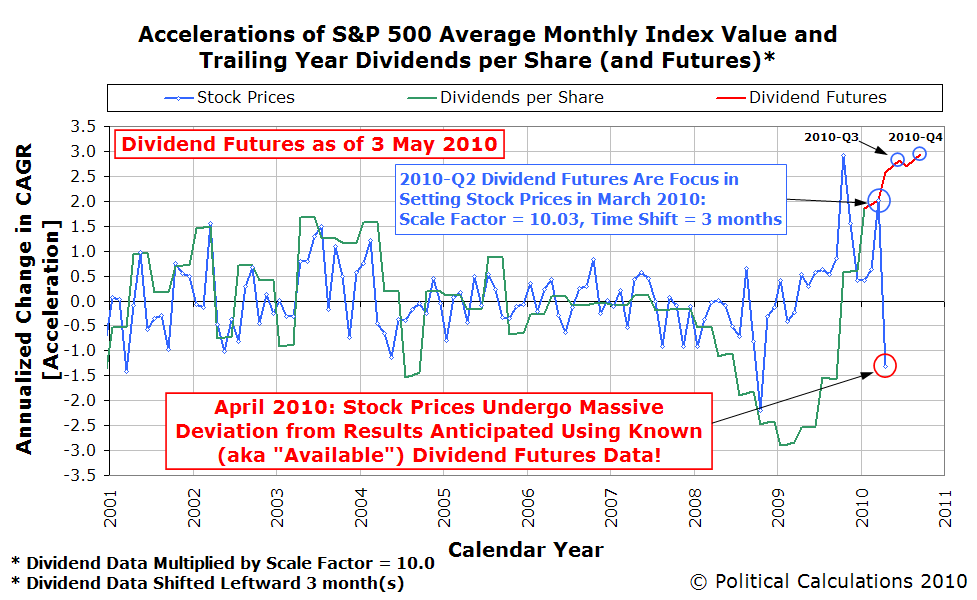 Our next chart shows what we observe in the change for the growth rate of stock prices. Here, we find a sudden, sharp deceleration in the growth rate of stock prices that is not matched by a corresponding change in the dividend futures data.
There are two factors we think might account for this change:
- Noise. There's always a degree of randomness in the level of stock prices in the market that's attributable to the millions upon millions of transactions that occur each month. While we can sometimes determine a specific cause for a significant deviation from what our model predicts, most of the time, we can account for the more common causes of randomness through the typical scale factor we apply to our calculations.
- A shift in investor time focus. Here, we suspect that investors have shifted their forward-looking focus to a specific point in the future beyond what we can see in the available data.
We believe that what we observe in the change in the growth rate of stock prices in April 2010 is a combination of these factors. We suspect the change is too great to be driven just by noise alone, and that a shift in investor time focus beyond what we can determine using the index futures contract that expires in December 2010, the limit of where we can see into the future, has occurred.
 And this is where the inverse problem lies! Here, we've used our math to work out what the expected future growth rate of dividends per share would have to be to match what we observe in today's stock prices.
Applying our mid-point amplification factor of 9.0, we calculate that investors would have to expect that the S&P 500's trailing year dividends per share would to fall to $20.90 to fully account for what we observe in April 2010's stock prices.
Turning around and using that value to anticipate where stock prices will go in May 2010, we find that the average of stocks prices during the month will likely fall somewhere between 1148 and 1200. The most likely outcome is that stock prices will decline during the month.
Assuming that the effect of noise is minimal, that leads to an interesting question that we'll take on tomorrow: Why are investor expectations for the S&P 500's trailing year dividends per share so much lower than they are today, even as the futures data we do have suggest they'll grow through the end of the year?
Update 21 May 2010 (6:00 AM PDT): Using the data we have available for the month-to-date through 20 May 2010, we would project that stock prices will fall in the short term to a range between 1041 and 1095, with 1065 marking the effective midpoint. These values are based upon the typical amplification factors we use to correlate changes in the change in the growth rate of stock prices with changes in the growth rate of dividends per share (11.0, 6.5 and 9.0 respectively.)
Since the S&P 500 closed on 20 May 2010 at a level of 1071, we find that stock prices are so far consistent with a deteriorating level of dividends - unlike the "flash crash" of 6 May 2010, which we would attribute to noise, we believe stock prices are falling to levels consistent with changes in the fundamental outlook for the companies whose stocks make up the S&P 500. We are also observing that the deterioration in the expected future level of dividends appears to have begun on 18 May 2010, which we see in the dividend futures data we have available covering the period through December 2010.
In terms of the forecast we provided in our original post above, the changes we now observe in the dividend futures data indicates that the average of stock prices in May 2010 will fall below the low end of the range we provided at the beginning of the month.
Labels: chaos, dividends, forecasting, SP 500
Welcome to the blogosphere's toolchest! Here, unlike other blogs dedicated to analyzing current events, we create easy-to-use, simple tools to do the math related to them so you can get in on the action too! If you would like to learn more about these tools, or if you would like to contribute ideas to develop for this blog, please e-mail us at:
ironman at politicalcalculations
Thanks in advance!
Closing values for previous trading day.
This site is primarily powered by:
CSS Validation

RSS Site Feed
JavaScript
The tools on this site are built using JavaScript. If you would like to learn more, one of the best free resources on the web is available at W3Schools.com.
Other Cool Resources
Blog Roll


