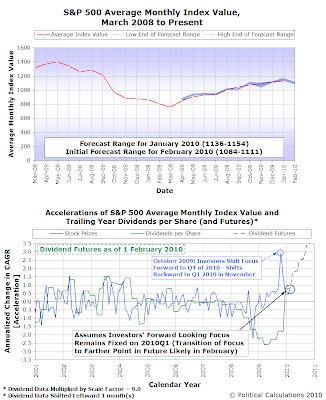
 Contrary to what many people might believe, politics plays a very small role with respect to the direction of the stock market. A lot of people, including at least one Nobel prize winning economist, will try to link either good or bad stock market performance to the policies of those occupying positions of political power. By and large though, we find that the stock market really doesn't care - there are other, stronger drivers of stock prices, which reduces the influence of politics over the stock market to little more than noise.
And yet, there are times when the noise that politics generates does significantly affect the level of stock prices.
We had a prime example of that effect in January 2010. Here, at the beginning of January, we had used our model of the primary driver of stock prices, the change in the expected future growth rate of the stock market's dividends per share, to forecast that the average of the S&P 500 in January 2010 would fall into a range between 1136 and 1154.
For most of the month, the S&P 500 behaved just as we had forecast - all the way up through 20 January 2010.
But on 21 January 2010, something broke. At 10:20 AM. It turns out that the renomination of Federal Reserve Chairman Ben Bernanke ran into an unexpected snag, which first hit the Internet's streaming newsfeeds at 10:17 AM. In the next two to three minutes, investors absorbed the previously unexpected information and reacted, sending stock prices lower. Significantly lower. All because President Obama hadn't covered all the bases he had needed to ensure a smooth renomination process in the U.S. Senate.
The reaction carried through Friday, 22 January, 2010, as a number of senators announced their opposition to Bernanke's renomination. Over the weekend, it became clear that Bernanke's nomination would receive sufficient support, so stock prices stopped their descent and rebounded a bit.
Until Wednesday, 27 January 2010. Stocks started the day on a positive note, then proceeded to go into the tank, following a very disappointing earnings report from Motorola. Despite having earned a profit in the fourth quarter of 2009, its sales in the quarter were less than had been expected, with the possible result that its future revenues would be lower than had been anticipated.
Investors reacted by projecting Motorola's woes onto the entire technology sector of the stock market, dragging their prices down, with the collateral damage affecting stocks outside the sector.

Taking that average value of 1124.69 into account, we would now project that the S&P 500 will fall between 1084 and 1111 in February 2010 using our math, assuming that investors continue to focus on where the S&P 500's dividends per share in the fourth quarter of 2010 will be.
We would anticipate that sometime during this month, investors will shift their focus toward a point in time farther in the future, which will require us to revise our forecast as the fundamental drivers behind stock prices will have changed.
The noise we can't do much about, since it's random in both its timing and effect. But what we can do is better characterize it, which will be something we explore later this month....
Labels: chaos, SP 500, stock market
Welcome to the blogosphere's toolchest! Here, unlike other blogs dedicated to analyzing current events, we create easy-to-use, simple tools to do the math related to them so you can get in on the action too! If you would like to learn more about these tools, or if you would like to contribute ideas to develop for this blog, please e-mail us at:
ironman at politicalcalculations
Thanks in advance!
Closing values for previous trading day.
This site is primarily powered by:
CSS Validation
RSS Site Feed
JavaScript
The tools on this site are built using JavaScript. If you would like to learn more, one of the best free resources on the web is available at W3Schools.com.