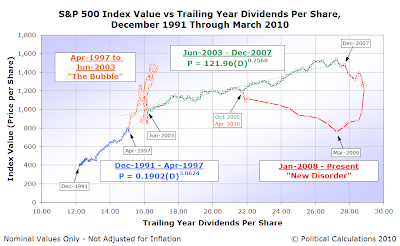
Just in case anyone still wonders what really drives stock prices in the long term, our chart showing the S&P 500's average monthly index value against the index' trailing year dividends per share should help remove any doubts.

What's more, since we are now observing the bottoming of the stock market's trailing year dividends per share, the conditions under which orderly growth can occur in the stock market will soon emerge. Those conditions require that the market's trailing year dividends per share grow in value over time as a basic requirement to allow orderly growth to occur.
At present, the data indicates the earliest that might occur approximately around June 2010.
Unfortunately, we don't yet know how long such a period might exist, since the dividend futures data that we use to create our forecasts only extends through the fourth quarter of 2010, at least as of this writing.
What we find more remarkable in the chart however is that whatever new period of order might soon emerge will do so from a level that would fall along the average projection curve defining the previous period of order in the market.
We saw this phenomenon before with the Dot-Com Bubble, where orderly growth resumed in the market after the disruptive event of the bubble concluded almost precisely at the average price level where it would have been placed by the market's trailing year dividends per share as defined by the market's previous period of order. Here, during the period from April 1997 through June 2003, the market first soared above that projected trajectory, then plummeted below it, before finally climbing back to it and embarking on a new stable trajectory. That period of order then held until December 2007.
Now, with positive trailing year dividend growth set to resume in the very near future, we see that phenomenon again with the stock market at this point in April 2010, with both stock prices and trailing year dividends per share approximately where they were in October 2005. And as it happens, right about at the level given by the projected trajectory for stock prices with respect to trailing year dividends per share that existed in the middle of the previous period of orderly growth.

We find instead that stock prices in the long run are primarily a direct function of the value of their underlying dividends per share. In the short run, stock prices are primarily driven by changes in the expected rate of growth of the market's dividends per share. We find that noise, driven by common, randomly-timed events in the market, accounts for much of the deviation we see in both the short and long runs for the market.
If order does emerge in June 2010, the next six months will largely set the trajectory that we can reasonably expect stock prices to follow into the future. Knowing that trajectory will then allow us to project the future level of stock prices with a reasonable level of accuracy months, if not years, into the future - basically, as far as the available dividend futures data will allow us to see.
Provided, of course, that no new disruptive events occur that throw the market for another loop!
Labels: chaos, SP 500, stock market
Welcome to the blogosphere's toolchest! Here, unlike other blogs dedicated to analyzing current events, we create easy-to-use, simple tools to do the math related to them so you can get in on the action too! If you would like to learn more about these tools, or if you would like to contribute ideas to develop for this blog, please e-mail us at:
ironman at politicalcalculations
Thanks in advance!
Closing values for previous trading day.
This site is primarily powered by:
CSS Validation
RSS Site Feed
JavaScript
The tools on this site are built using JavaScript. If you would like to learn more, one of the best free resources on the web is available at W3Schools.com.