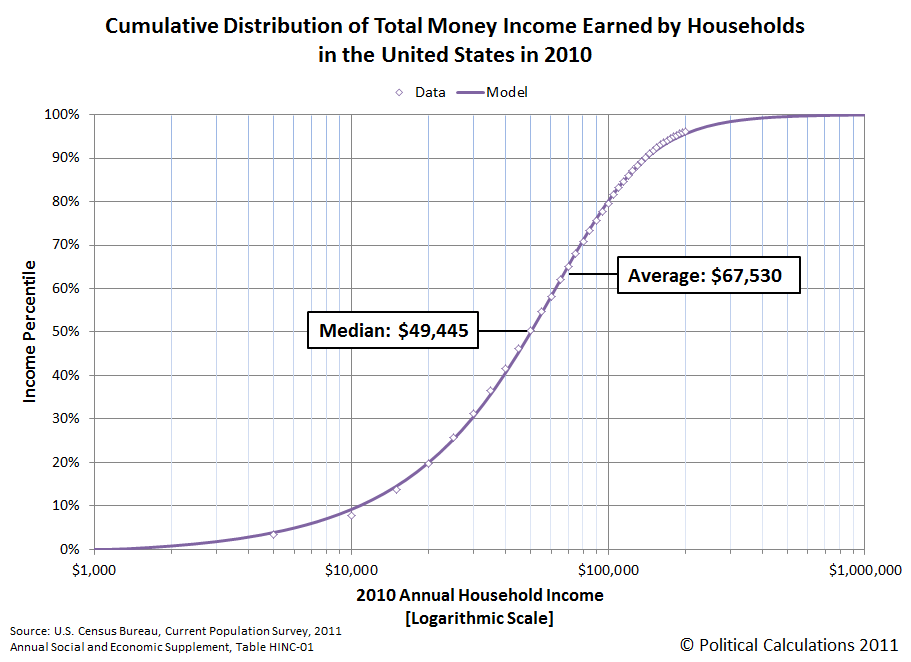
In 2010, the median household income in the United States was $49,445, which was down from the $49,777 that had been recorded in 2009.
Meanwhile, average household income in the U.S. was $67,530 for 2010, which was likewise down from 2009's figure of $67,976.
Both figures for 2010, along with the rest of the cumulative distribution of household income in the United States for 2010, are presented in the following chart, which shows the U.S. household income distribution in terms of percentiles:
As we did with the individual distribution of income for 2010, we've built a tool you can use to see where you might fall in percentile terms among all U.S. households where your household income is concerned.
Accounting for 2010's average 1.6% rate of inflation, which would boost household median income in 2009 up to $50,599 in 2010 U.S. dollars, real median household income fell by 2.3%, from $50,599 to $49,445.
Overall, the U.S. Census counted 118,682,000 households in 2010, marking an increase of 1,144,000 households in the U.S. from 2009. With 211,254,000 people counted as having earned income in 2010, that puts the average number of income earners per U.S. household at 1.782. The average number of income earners per U.S. household was 1.797 in 2009 and 1.808 in 2008, when this ratio last peaked in value.
On a side note, in 2010, the U.S. federal government spent $3.456 trillion dollars, which represents spending in excess of $29,121 per U.S. household, which is slightly down from the $29,968 it spent per U.S. household in 2009.
For a median household income of $49,455, the typical American household can only afford for the U.S. government to spend, at most, $20,794 per household. To be able to afford a federal government that spends $29,121 per U.S. household, the median household income of the United States would have to rise to just over $68,250.
Finally, here is our chart showing the cumulative distribution of income among all U.S. households with the number of households.
Update 15 September 2011: We've retitled the chart and relabeled the vertical axis to better clarify what data is being shown in the chart below - the original version is still available by clicking here:

Data Sources
U.S. Census. Current Population Survey. Annual Social and Economic (ASEC) Supplement. HINC-01. Selected Characteristics of Households by Total Money Income in 2010. Accessed 13 September 2011.
U.S. Census. Current Population Survey. Annual Social and Economic (ASEC) Supplement. HINC-01. Selected Characteristics of Households by Total Money Income in 2009. Accessed 13 September 2011.