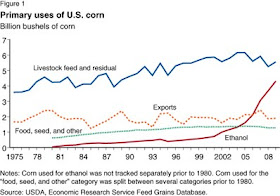
Let's start with some corn facts:

In 2005, the U.S. produced 42 percent of the world’s corn. Over 50 percent of the U.S. crop is produced in Iowa, Minnesota, Nebraska or Illinois. Other states in which corn is grown include Kentucky, Ohio, Indiana, Wisconsin, South Dakota, Wisconsin and Missouri. In 2005, over 58 percent of the U.S. corn crop was used for feed. The remaining U.S. crop was split between exports (25 percent) and food, seed or industrial uses such as ethanol production (17 percent).
How much of the U.S. corn crop is used for feed today?

If the percentage of the U.S. corn crop used for feed has been shrinking over time, where is the rest of the U.S. corn crop going instead?

How might that change have affected the price of corn?

And how might that have affected the cost of meat produced from corn-fed livestock?

Now, who is most responsible for that problem?

Do you suppose the U.S. Congress will propose a "meat transaction tax" to deal with the problem of rising meat inequality instead of actually stopping doing the stupid things that created the problem in the first place?
Previously on Political Calculations
- Subsidies and Shortages
- Are U.S. Ethanol Producers Profitable?
- Booming Ethanol Consumption in the U.S.
- Of Cows, Subsidies and Amtrak
- Turkey-a-Go-Go: The Diminishing Bird
- Comparing MPGs for Alternative Fuel Vehicles
- Turkeymania 2008!
- A Better Ethanol Solution?
Image Credits: The Big Picture, Agri-Pulse, The E-xchange, Soyatech, State of Texas Window on State Government, U.S. State Department.