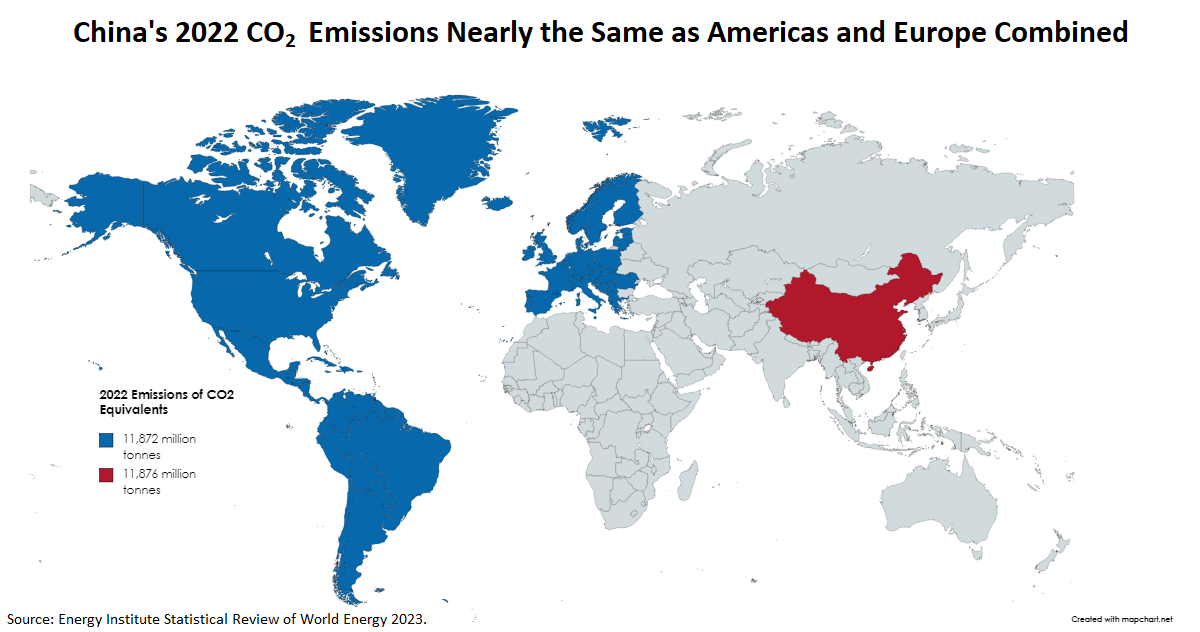
The Energy Institute has taken over publishing the annual Statistical Review of World Energy from BP this year. This year's edition has the world's carbon dioxide emission data available through 2022, which reveals just how incredibly large China's carbon dioxide equivalent emissions from its energy production and process emissions plus any methane and flaring operations are compared to the rest of the world.
We've created the following map to illustrate how many other nations' CO₂ emissions it takes to nearly match China's output.
In putting the map together, we started with the next largest source (the United States) and kept adding adjacent countries with the goal of trying to match China's 2022 CO₂ output without going over it. When we ran out of countries to include in the Americas, we switched to Europe and started with that continent's largest source of carbon dioxide emissions (Germany) and continued the process. Had China's emissions been just 44.3 million tonnes higher, Bulgaria would have been included with the other nations of Europe.
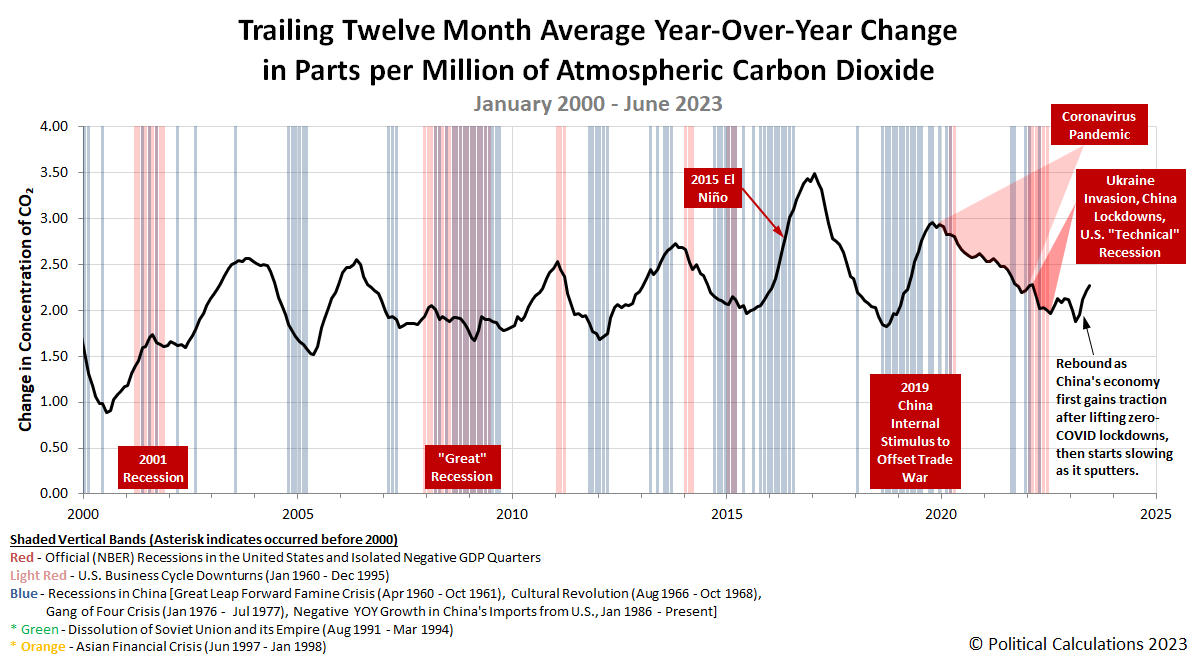
Looking at 2023, we find the rate at which carbon dioxide is accumulating in the Earth's atmosphere slowed a bit from its pace of increase since the Chinese government ended its zero-COVID lockdowns at the end of December 2022. The following chart shows the latest rise in the rate of CO₂ accumulation in the Earth's atmosphere based on measurements of its changing concentration taken by the Mauna Loa Observatory.
The big story here continues to be the faltering of China's economy, which isn't responding as expected to the Chinese government's stimulus efforts. Those stimulus efforts have included the expansion of China's coal production industry and its imports of coal to power it's new coal-fired power generation plants to sustain its internal economic growth.
Data sources confirm China's emissions in 2023 are substantially higher than they were before the Coronavirus Pandemic:
We examined data from Carbon Monitor, which provides science-based estimates of daily CO₂ emissions across the world. We compared emissions data from January to April 2019 (which represents typical pre-pandemic conditions in China) with the corresponding months in 2023. This period followed the removal of most COVID-related restrictions in China – such as testing requirements and quarantine rules – which essentially restored the country’s economy to business-as-usual.
We found average daily carbon emissions increased substantially between the two periods. In the first four months of 2019, China’s transport, industry, energy and residential sectors together emitted an average 28.2 million tonnes of CO₂ a day. In the first four months of 2023, daily emissions from those sectors were an average 30.9 million tonnes....
Energy production from solar and wind in China did increase substantially between the two periods. But the growth was outweighed by electricity generated from fossil fuels.
Separate data show the growth of coal production in China has accelerated. In the two years prior to the pandemic, coal production variously fell or only grew slightly. But coal production grew during the pandemic, and this has continued. In the year to April 2023, coal production increased by about 5%.
While coal’s share of energy consumption fell substantially from 2007 to 2019, it has changed little since then. That’s mainly because energy use is growing fastest in the electricity sector, which remains dominated by coal.
Leaving China behind and looking forward, the data through June 2023 is starting to reflect the contribution of a new El Niño event, the last two of which were accompanied by large wildfire events in Indonesia that contributed to extra carbon dioxide entering the Earth's air. This year, the very large, mostly unmitigated wildfires in Canada are already adding to the extra CO₂ contribution.
References
National Oceanographic and Atmospheric Administration. Earth System Research Laboratory. Mauna Loa Observatory CO2 Data. [Text File]. Updated 5 July 2023.
Energy Institute. EI Statistical Review of World Energy 2023. [PDF Document]. 26 June 2023.
maanyos. China emits more CO2 than the entire Western hemisphere. r/dataisbeautiful. September 2022. maanyos' map is the original inspiration behind our own updated map, which we chose to generate using the same tool, but following a different methodology.

