According to Motio Research, median household income in November 2023 was $77,084. The estimated income earned by a household at the exact middle of the income distribution in the United States increased by $205, or 0.27%, from Motio Research's initial estimate of $76,879 for October 2023.
Motio Research is picking up the legacy of Sentier Research in producing monthly estimates of median household income. The firm is following the methodology that Sentier Research pioneered, which utilizes microdata collected through the U.S. Census Bureau's ongoing Current Population Survey to produce its monthly estimates. In doing so, the firm's founders, Matías Scaglione and Romina Soria, are filling a gap that was left behind after Sentier Research closed up shop in February 2020 after reporting its median household income estimate for December 2019.
Motio Research's latest monthly estimates are available to the public via the Motio U.S. Real Median Household Income Index (MHII), a median household income index adjusted for inflation and seasonality. Here's a static screenshot of the interactive chart of Motio's MHII showing its value from January 2010 through November 2023:
Here is their description of what the chart shows for the current trend for inflation-adjusted median household income:
The index has registered its fifth monthly expansion since hitting a post-Covid low in May 2023, affirming the sustained upward trend observed since June/July 2023. Although the November 2023 value of 112.5 is the highest since December 2020, it still falls below the pre-Covid peak in February 2020. The index also reflects a further deceleration after a notable jump in September.
Here is their description of the historical data presented in the chart:
The MHII begins with a value of 100.0 in January 2010 and reaches a value of 112.3 in October 2023, equivalent to $76,879 (see chart below). The index initially declined, reflecting the lingering impact of the Great Recession until mid-2011. Subsequently, it experienced a prolonged bottom until mid-2012 and then consistently rose until the onset of the Covid pandemic. The spike and sharp decline in March-October 2020 are primarily attributed to the effect of nonresponse bias in the CPS during the initial months of the pandemic.
The pandemic "spike" affected the collection of data used to generate the U.S. Census Bureau's annual estimate for 2019. U.S. Census Bureau officials have estimated the nonresponse bias inflated its 2019 median household income estimate by 2.8% because the pandemic and government-mandated lockdowns disrupted its collection of data from lower income-earning households. The data for the U.S. Census Bureau's annual estimate of median household income in the United States is collected in March of each year. March 2020, of course, is when the coronavirus pandemic made its presence felt in the United States.
Analyst's Notes
We're excited to welcome Motio Research's survey-based median household income estimates because this data provides an important window into the economic situation of the typical American household. We had originally developed our own estimates of median household income as a complement to Sentier Research's monthly estimates, so we're very happy to resume serving that role now that Motio Research has entered the field.
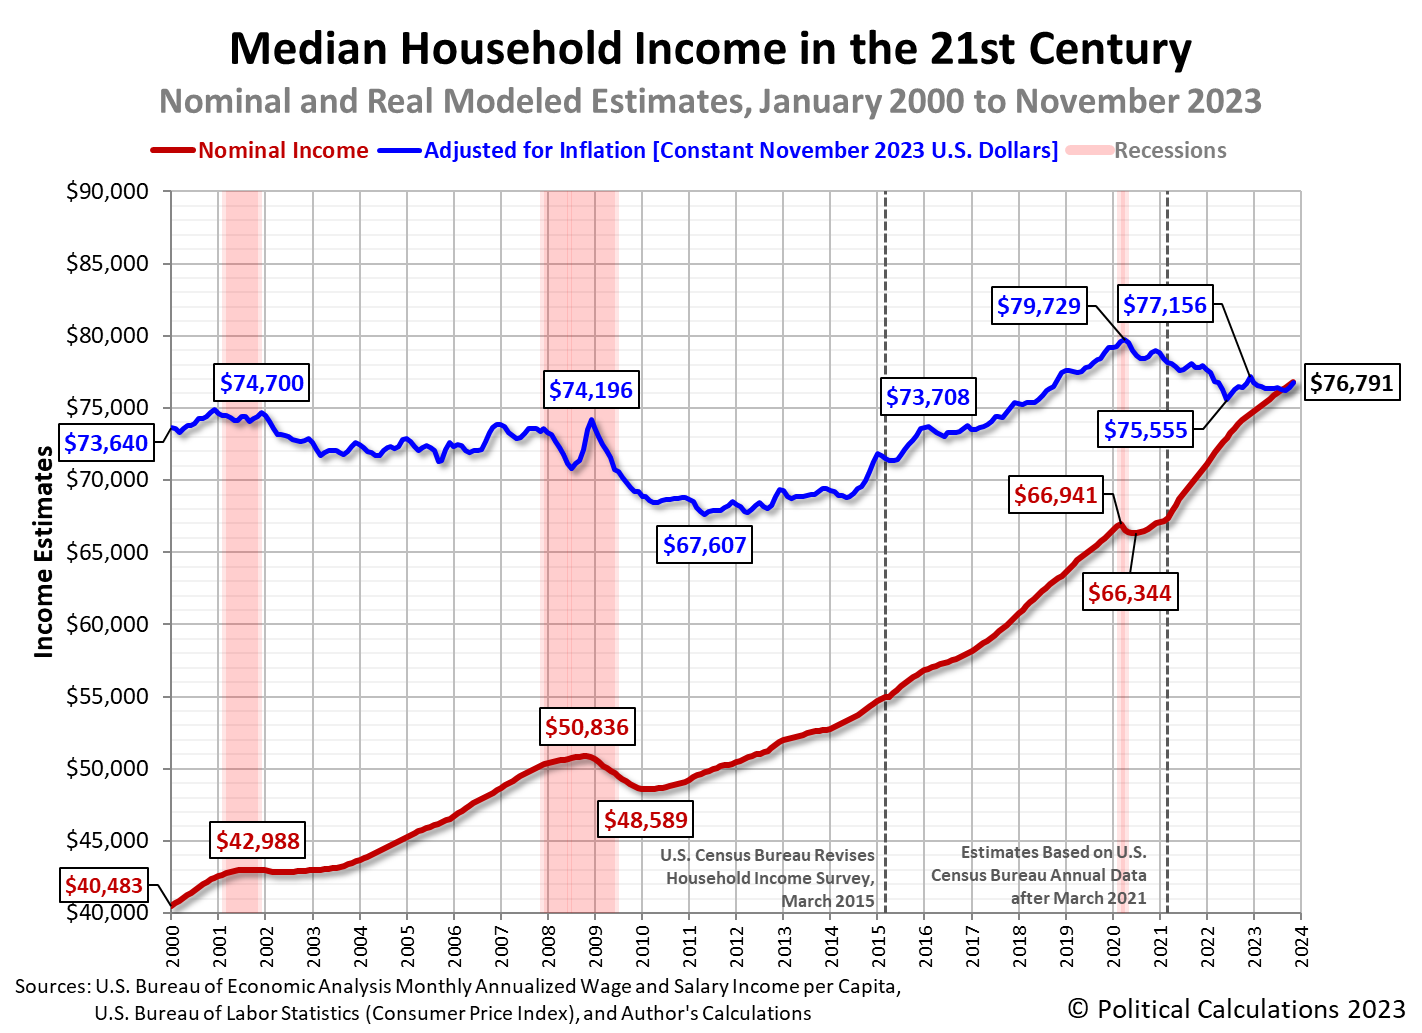
Speaking of which, Political Calculations' initial estimate of median household income in November 2023 using our alternate methodology is $76,791, which is $293 (0.38%) below Motio Research's estimate for the month.
The latest update to Political Calculations' chart tracking Median Household Income in the 21st Century shows the nominal (red) and inflation-adjusted (blue) trends for median household income in the United States from January 2000 through November 2023. The inflation-adjusted figures are presented in terms of constant November 2023 U.S. dollars.
November 2023's estimated median household income estimate of $76,791 represents a $203 (0.27%) increase over our initial estimate of $76,588 for October 2023.
For the latest in our coverage of median household income in the United States, follow this link!
References
U.S. Bureau of Economic Analysis. Table 2.6. Personal Income and Its Disposition, Monthly, Personal Income and Outlays, Not Seasonally Adjusted, Monthly, Middle of Month. Population. [Online Database (via Federal Reserve Economic Data)]. Last Updated: 22 December 2023. Accessed: 22 December 2023.
U.S. Bureau of Economic Analysis. Table 2.6. Personal Income and Its Disposition, Monthly, Personal Income and Outlays, Not Seasonally Adjusted, Monthly, Middle of Month. Compensation of Employees, Received: Wage and Salary Disbursements. [Online Database (via Federal Reserve Economic Data)]. Last Updated: 22 December 2023. Accessed: 22 December 2023.
U.S. Department of Labor Bureau of Labor Statistics. Consumer Price Index, All Urban Consumers - (CPI-U), U.S. City Average, All Items, 1982-84=100. [Online Database (via Federal Reserve Economic Data)]. Last Updated: 12 December 2023. Accessed: 12 December 2023.
Image credit: Household Income by Nick Youngson. Creative Commons 3 - CC BY-SA 3.0 Alpha Stock Images.


