When the U.S. Census Bureau released its annual estimate for 2022's median household income 12 September 2023, it confirmed something we've suspected for the past year. The relationship between average personal income and median household income has changed.
It also solved a challenge we had, because we didn't have enough data to quantify that change until the report was issued. But since we now have it, let's get to it!
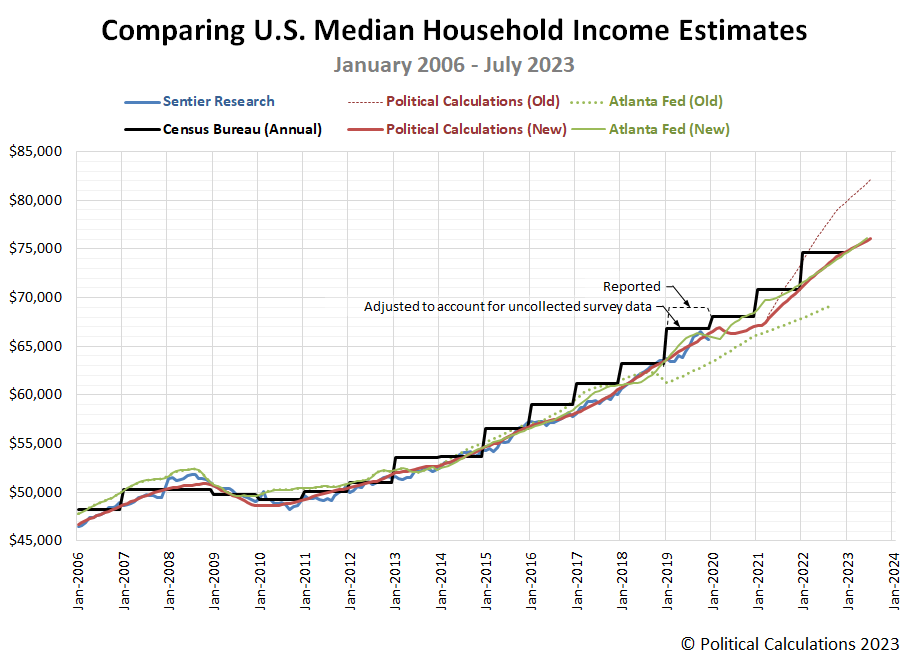
Political Calculations' basic methodology for estimating median household income on a monthly basis was last updated in December 2019. The following chart reveals how its estimates compare with those of other sources, including the U.S. Census Bureau's annual estimates through the 2022 calendar year. The chart also indicates how we and other sources for median household income data have revised their estimates over time.
Here's what's going on in the chart. The heavy black "steps" represent the U.S. Census Bureau's annual estimates. These values can be considered to correspond to twelve months of income received through the end of December in their indicated calendar year. That data is collected by the Census Bureau in its Annual Social and Economic Supplement (ASEC) survey of tens of thousands of American households in March of the following year, which is then compiled and analyzed for six months before finally being reported to the public in September.
Because median household income is highly useful demographic information, analytical firms have sought to generate estimates of it more frequently. Sentier Research was the most successful, using data collected by the U.S. Census Bureau's monthly Current Population Survey to generate survey-based estimates of median household income every month, which it did from January 2006 through December 2019. The blue line in the chart corresponds to those estimates.
Sentier Research however closed up shop after reporting its median household income data for December 2019. After they shut down, only two sources were left to provide monthly estimates of this demographic factor: the Federal Reserve Bank of Atlanta and Political Calculations. Both the Atlanta Fed and Political Calculations developed models to estimate median household, which have periodically been revised.
The chart shows the Atlanta Fed's estimates in green and Political Calculations in red. The dotted data series for each represents old estimates that have since been superseded and replaced by new estimates that are shown as solid lines. As you can see, both the Atlanta Fed's and Political Calculations' revised models are in close agreement with each other. The Atlanta Fed's last model revision took place about a year ago, ours is taking place... now!
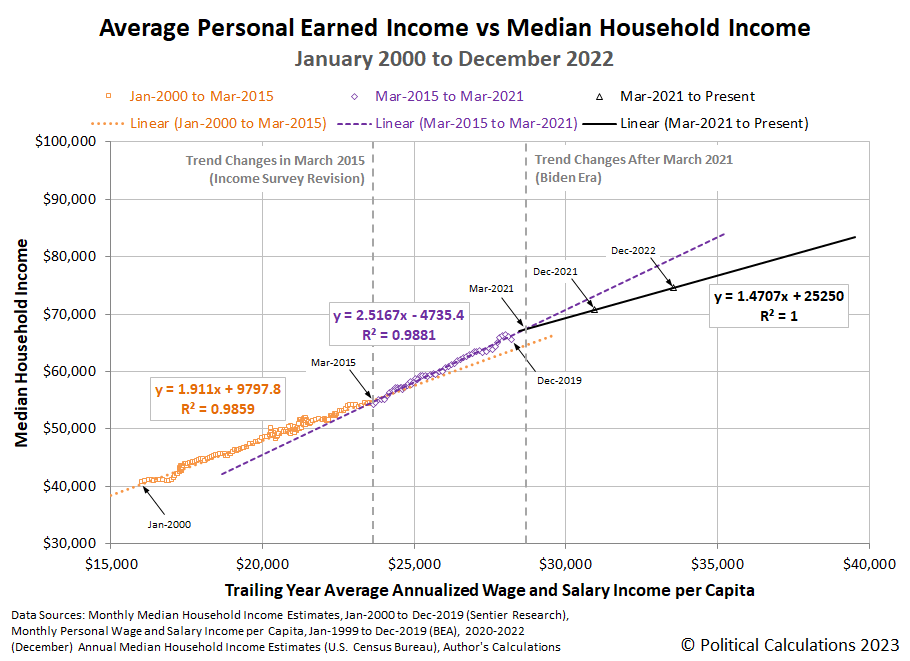
We've been waiting for the Census Bureau's September 2023 release of 2022's annual median household income data because it provides enough data uncomplicated by data collection issues associated with 2020's coronavirus pandemic to update our modeling based on the relationship between average personal income and median household income. After we got the data, we were able to determine the previous trend that began in March 2015 does not hold past March 2021, after which, the deviation between our estimates and the U.S. Census Bureau's annual survey-based estimates grows larger with time, with our estimates running to the high side of them.
Since the relationship between trailing year average personal income and median household income is linear, we could take advantage of it to determine when the transition from old relationship to new relationship occurred, which ultimately tracked back to March 2021 as the break between old and new trends. The following chart shows those relationships, adding the new trend to the two that preceded it:
We tried to track down the Atlanta Fed's explanation of how they modified their model, which had been increasingly falling out of sync with the Census Bureau's annual estimates to the low side over time before it was revised, but came up empty. They have however provided some explanation of how they produce their estimates in the Frequently Asked Questions for their Home Ownership Affordability Monitor.
For our modeling however, we can use the strong relationship that existed between average personal income and median household income from March 2015 through March 2021 as a counterfactual, or rather, a reasonable projection of what median household income would be had the relationship continued. Since this article is long enough already, we'll take advantage of that property in the very near future in looking at how different our estimates are for median household income from our previous estimates from March 2021 through July 2023.
For the latest in our coverage of median household income in the United States, follow this link!
References
Here are the major milestone posts in our median household income series where we either introduced or announced modifications to our analytical methods.
- June 2017 Median Household Income
- April 2018 Median Household Income
- Telescoping Median Household Income Back in Time
- Median Household Income in June 2019
- Median Household Income in December 2019
Here's a summary of entries in the series addressing substantial revisions to the data we use to create our median household income estimates or that compares those results to estimates published by other sources.
- Median Household Income in April 2019
- Median Household Income in October 2019
- How the Pandemic Affected U.S. Median Household Income
- Different Views of Monthly Median Household Income
- Comparisons of U.S. Median Household Income Estimates
- Median Household Income in August 2022
- Median Household Income in April 2023
Data Sources
U.S. Bureau of Economic Analysis. Table 2.6. Personal Income and Its Disposition, Monthly, Personal Income and Outlays, Not Seasonally Adjusted, Monthly, Middle of Month. Population. [Online Database (via Federal Reserve Economic Data)]. Last Updated: 31 August 2023. Accessed: 31 August 2023.
U.S. Bureau of Economic Analysis. Table 2.6. Personal Income and Its Disposition, Monthly, Personal Income and Outlays, Not Seasonally Adjusted, Monthly, Middle of Month. Compensation of Employees, Received: Wage and Salary Disbursements. [Online Database (via Federal Reserve Economic Data)]. Last Updated: 31 August 2023. Accessed: 31 August 2023.
U.S. Census Bureau. Current Population Survey, 1968 to 2023 Annual Social and Economic Supplements (CPS ASEC). [Excel Spreadsheet]. 12 September 2023.
Federal Reserve Bank of Atlanta. Home Ownership Affordability Monitor. [Online Database]. Accessed 12 September 2023.
Image credit: Rising stack of U.S. coins photo by Gabriel VanHelsing on Wikimedia Commons. Creative Commons. CC0 1.0 Universal (CC0 1.0) Public Domain Dedication.
Labels: median household income
Welcome to the blogosphere's toolchest! Here, unlike other blogs dedicated to analyzing current events, we create easy-to-use, simple tools to do the math related to them so you can get in on the action too! If you would like to learn more about these tools, or if you would like to contribute ideas to develop for this blog, please e-mail us at:
ironman at politicalcalculations
Thanks in advance!
Closing values for previous trading day.
This site is primarily powered by:
CSS Validation
RSS Site Feed
JavaScript
The tools on this site are built using JavaScript. If you would like to learn more, one of the best free resources on the web is available at W3Schools.com.


