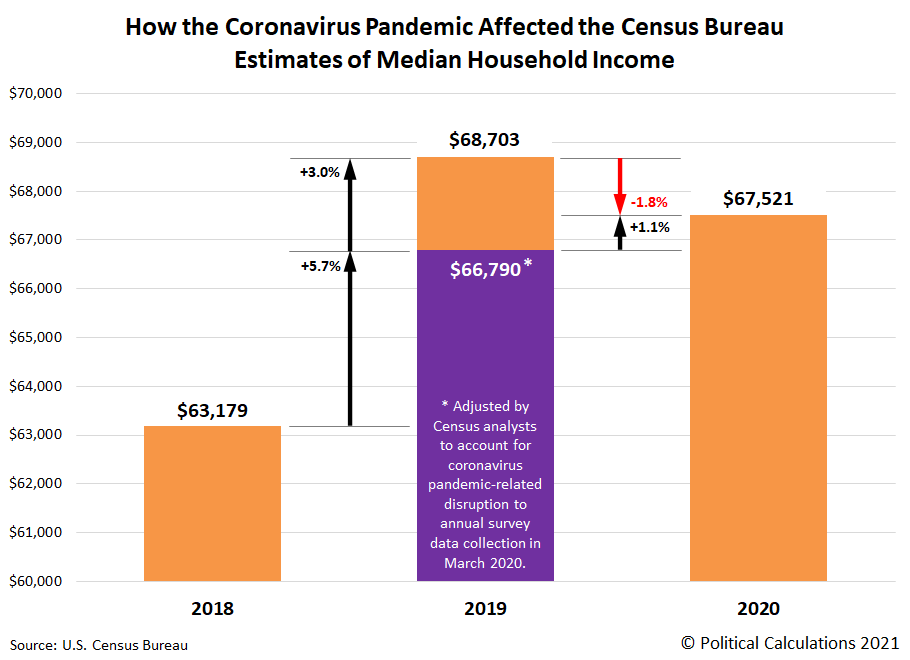
The U.S. Census Bureau released its annual estimate for median household income in the U.S. for the 2020 calendar year on 14 September 2021. It reported median household income for the 2020 calendar year was $67,521.
If you compare that number with the official estimate of median household income of $68,703 reported for the 2019 calendar year, that is a 1.8% decline. But there was a big problem with the 2019 estimate. The Census Bureau was collecting the data that would be used to determine that figure in March 2020, when the coronavirus pandemic reached the U.S. and the lockdowns imposed by state and local governments to "flatten the curve" disrupted the Census Bureau's ability to collect data. It particularly affected the rate of responses for its Current Population Survey's Annual Social and Economic Supplement from lower income households, where many households in this demographic group did not respond.
Census Bureau analysts have estimated that had they been able to collect a more complete data sample, they would have estimated median household income to be $66,790 for the 2019 calendar year, which we first reported in October 2020. And that brings us to the most remarkable aspect of the median household estimate for 2020. If not for the disruptive effect of the pandemic lockdowns, median household income would have risen by 1.1% from the adjusted estimate for 2019 to 2020's official estimate.
The following chart shows the Census Bureau's estimates of median household income from 2018 through 2020, illustrating how different 2019's estimate would be when accounting for the pandemic's disruption.
Only the Census Bureau's official estimate for 2019 was significantly impacted by the coronavirus pandemic. It wasn't a factor at all in March 2019 when data was collected for the 2018 calendar year, and it wasn't a significant factor in March 2021 when data was collected for 2020. The data sources supporting our exclusive analysis are presented below.
References
U.S. Census Bureau: Jessica Semega, Melissa Kollar, John Creamer, and Abinash Mohanty. Report Number P60-266. Income and Poverty in the United States: 2018. [PDF Document]. 15 September 2020.
U.S. Census Bureau: Jessica Semega, Melissa Kollar, Emily A. Shrider, and John Creamer. Report Number P60-270. Income and Poverty in the United States: 2019. [PDF Document]. 15 September 2020.
U.S. Census Bureau: Jonathan Rothbaum and Adam Bee. Coronavirus Infects Surveys, Too: Survey Nonresponse Bias and the Coronavirus Pandemic. [PDF Document]. 3 May 2021.
U.S. Census Bureau: Emily A. Shrider, Melissa Kollar, Frances Chen, and Jessica Semega. Report Number P60-273. Income and Poverty in the United States: 2020. [PDF Document]. 14 September 2021.
Labels: data visualization, median household income
Welcome to the blogosphere's toolchest! Here, unlike other blogs dedicated to analyzing current events, we create easy-to-use, simple tools to do the math related to them so you can get in on the action too! If you would like to learn more about these tools, or if you would like to contribute ideas to develop for this blog, please e-mail us at:
ironman at politicalcalculations
Thanks in advance!
Closing values for previous trading day.
This site is primarily powered by:
CSS Validation
RSS Site Feed
JavaScript
The tools on this site are built using JavaScript. If you would like to learn more, one of the best free resources on the web is available at W3Schools.com.
