Over the last several months, global atmospheric carbon dioxide data has been rising. That outcome was to be expected after the Chinese government lifted its zero-COVID lockdowns. China is, after all, the world's largest contemporary producer of total CO₂ emissions by a widening margin and has become the third largest per capita CO₂ emitter, which is amazing given how large its population is. No more lockdowns would mean more economic activity and more carbon dioxide emissions from the country.
But after a strong start, China's economic recovery began sputtering. Even so, the pace at which carbon dioxide accumulates in the Earth's air continued rising at a fast clip.
The problem with that is it shouldn't have been given China's economic problems. China was getting very little economic bang for its fossil fuel-burning buck, so to speak.
Last month, we resolved that anomaly thanks to reports of drought conditions in China. Those conditions prompted the Chinese government to take two steps. First, they ordered many Chinese hydroelectric facilities to stop producing energy, preserving the dwindling water supply at its dammed reservoirs. Second, they ordered more coal-fired power generation plants online to attempt to make up for the loss of CO₂-free electricity produced by its now offline hydroelectric power plants.
These actions account for why CO₂ levels continued to rise even though China's economy experienced little economic gain to go along with it.
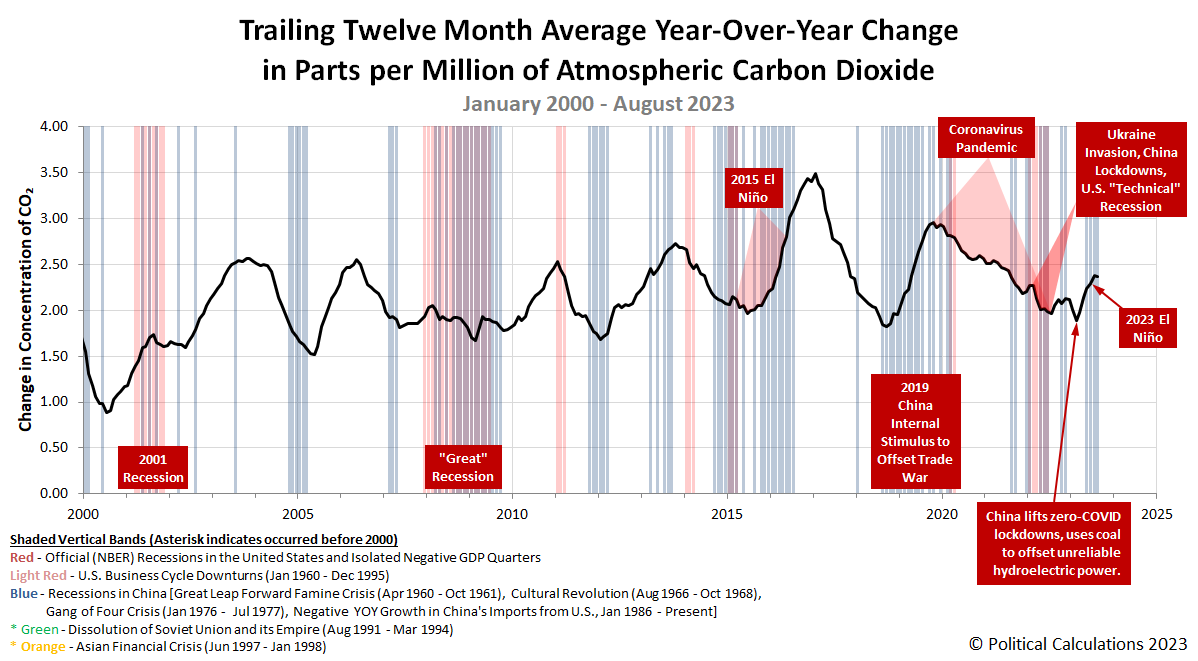
August 2023 atmospheric CO&8322; concentration data indicates a pause in its rate of increase, which is shown in the following chart. This change suggests China's economic troubles may have finally caught up with its stimulated efforts to keep its lights on.
How long the pause might last remains to be seen. At some point, China's hydroelectric plants should come back online and China's economy should start growing again. The first factor would be expected to reduce the country's CO₂ output, the other to increase it. It's an open question how it will net out as these positive developments happen.
What if there are more negative developments? The Chinese government has repeatedly demonstrated its willingness to ramp up coal-based power plants to support stimulus efforts to offset negative headwinds for its economy should they continue. In addition to its drought-related problems, we can point to its 2015-16 stimulus and its response to the 2018-19 tariff war with the U.S. as recent examples when it did.
At this point, it would be more remarkable if they did not. With the Chinese government rushing to get as many fossil fuel-burning power plants up and running as fast as it can, changes in atmospheric CO₂ levels will be telling us a lot about the state of China's economy for decades to come.
Image credit: Pollution (China) photo by Anjali aisha via Wikimedia Commons. Creative Commons. Attribution-ShareAlike 4.0 International (CC BY-SA 4.0).
Labels: environment
Welcome to the blogosphere's toolchest! Here, unlike other blogs dedicated to analyzing current events, we create easy-to-use, simple tools to do the math related to them so you can get in on the action too! If you would like to learn more about these tools, or if you would like to contribute ideas to develop for this blog, please e-mail us at:
ironman at politicalcalculations
Thanks in advance!
Closing values for previous trading day.
This site is primarily powered by:
CSS Validation
RSS Site Feed
JavaScript
The tools on this site are built using JavaScript. If you would like to learn more, one of the best free resources on the web is available at W3Schools.com.

