Motio Research reports median household income increased in March 2024. The firm estimates the income earned by a typical American household increased by $906 (+1.2%) from its initial estimate of $77,265 for February 2024.
Motio Research's estimates are based on income data collected by the U.S. Census Bureau as part of its monthly Current Population Survey. The firm adjusts its monthly estimates to account for the effects of seasonality and inflation in its data, presenting its results in the form of an index with the median household income of January 2010 assigned a value of 100. The initial value of the firm's U.S. Real Median Household Income Index for March 2024 is 116.0, rising above the index' pre-pandemic February 2020 level for the first time.
The following screenshot of Motio Research's interactive chart shows how this index has changed from January 2010 through March 2024:
Analyst's Notes
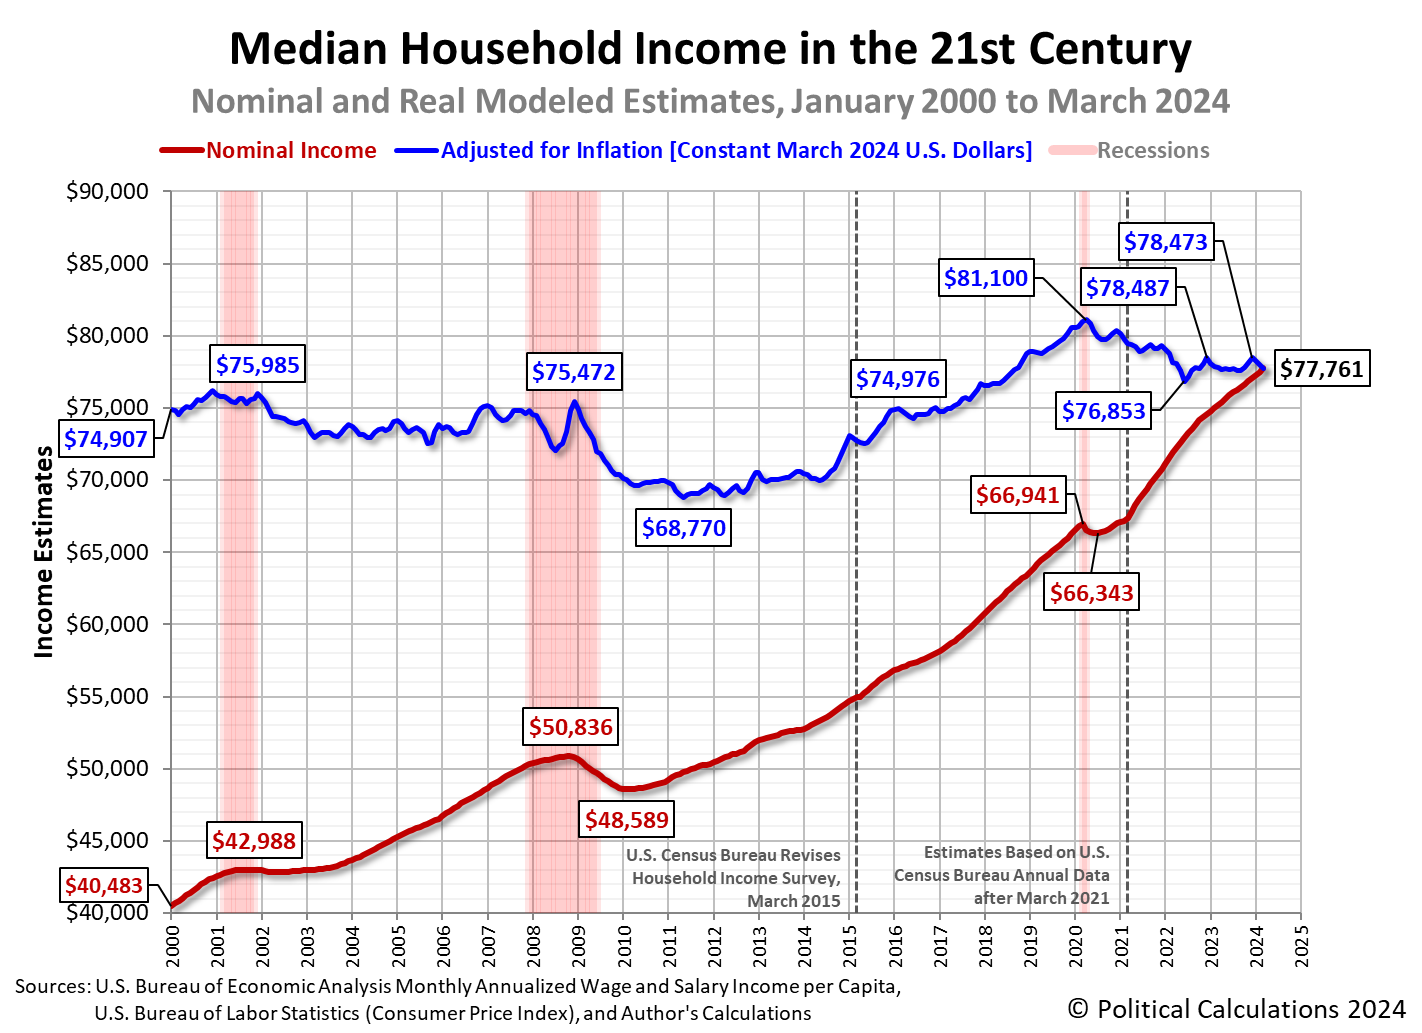
Political Calculations produces estimates of median household income that complement the monthly survey-based estimates produced by Motio Research. Our initial estimate of median household income in March 2024 based upon our alternate methodology is $77,761, which is $253 (+0.3%) higher than our initial estimate of $77,508 for February 2024. Our March 2024 estimate is $410 below Motio Research's initial survey-based estimate for the month.
The latest update to Political Calculations' chart tracking Median Household Income in the 21st Century shows the nominal (red) and inflation-adjusted (blue) trends for median household income in the United States from January 2000 through March 2024. The inflation-adjusted figures are presented in terms of constant March 2024 U.S. dollars and are not seasonally adjusted, unlike the data used to produce Motio Research's Household Income index:
The most important data series shown in the chart is the nominal, non-inflation adjusted monthly median household income estimates, which sets the bar for the "typical" American household's purchasing power. That's because Americans can only pay their bills in terms of nominal, non-inflation adjusted, non-seasonally adjusted dollars out of their nominal, non-inflation adjusted, non-seasonally-adjusted household incomes. Here the important thing to note is that the year-over-year growth rate of median household income has been essentially flat since September 2023, increasing at an annualized rate of 3.3 to 3.4% during the last seven months, the slowest pace at which it has increased since May 2021.
Finally, a quick note about the underlying data we use in developing our alternate median household income estimates. The U.S. Bureau of Economic Analysis made minor upward adjustments of less than 0.1% in the aggregate income estimates we use in crafting our estimates for both January and February 2024.
For the latest in our coverage of median household income in the United States, follow this link!
References
U.S. Bureau of Economic Analysis. Table 2.6. Personal Income and Its Disposition, Monthly, Personal Income and Outlays, Not Seasonally Adjusted, Monthly, Middle of Month. Population. [Online Database (via Federal Reserve Economic Data)]. Last Updated: 26 April 2024. Accessed: 26 April 2024.
U.S. Bureau of Economic Analysis. Table 2.6. Personal Income and Its Disposition, Monthly, Personal Income and Outlays, Not Seasonally Adjusted, Monthly, Middle of Month. Compensation of Employees, Received: Wage and Salary Disbursements. [Online Database (via Federal Reserve Economic Data)]. Last Updated: 26 April 2024. Accessed: 26 April 2024.
U.S. Department of Labor Bureau of Labor Statistics. Consumer Price Index, All Urban Consumers - (CPI-U), U.S. City Average, All Items, 1982-84=100. Not seasonally adjusted. [Online Database (via Federal Reserve Economic Data)]. Last Updated: 10 April 2024. Accessed: 10 April 2024.
Image Credit: California Tax Service Center. Public domain image.


