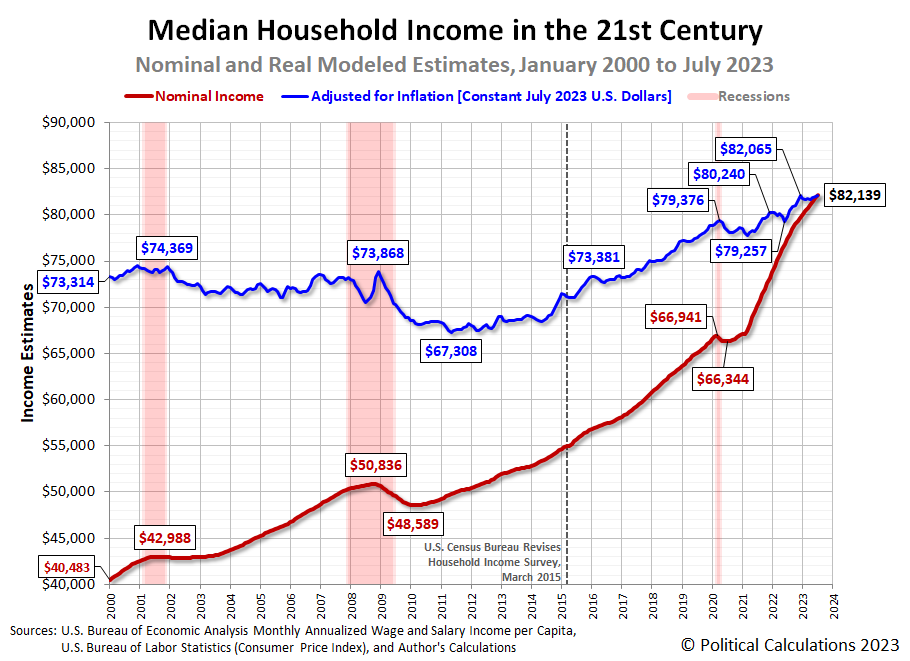
Political Calculations' initial estimate of median household income in July 2023 is $82,139, an increase of $296 (or 0.36%) from the initial estimate of $81,843 in June 2023.
Update 31 October 2023: We have revised our estimate of median household income for this month based on new information from the U.S. Census Bureau for 2022 and revisions to income data by the Bureau of Economic Analysis that were released in September 2023. Please follow this link to see how much. If you're interested, we've provided more information about what has changed and why we think its significant.
Adjusted for inflation, the month-over-month increase is $146 over June 2023's revised estimate of $81,993 in terms of constant July 2023 U.S. dollars. Though inflation remained muted in July 2023, it eroded over half of the nominal month-over-month increase in median household income.
On the positive side of the income ledger, July 2023's estimate rose above December 2022's inflation adjusted peak of $82,065 as expected. In doing so, it marked the end of what had been a period of relative stagnation during the first half of 2023 for the inflation-adjusted income of the typical American household.
The latest update to Political Calculations' chart tracking Median Household Income in the 21st Century shows the nominal (red) and inflation-adjusted (blue) trends for median household income in the United States from January 2000 through July 2023 The inflation-adjusted figures are presented in terms of constant July 2023 U.S. dollars.
Going back to the nominal, non-inflation adjusted data, the year-over-year rate of growth of median household income continues to slow. It peaked at 11.5% in March 2022, but has dropped to 6.2% as of July 2023. At its current rate of decline, it will drop below the 5% threshold sometime in the next four months.
Analyst's Notes
The BEA made minor downward adjustments to its aggregate income estimates for the months of April 2023 (-0.02%), May 2023 (-0.05%), and June 2023 (-0.01%) with its data release for July 2023.
Because we sometimes get questions about the terminology we use in presenting our estimates, we thought we'd take a moment to address the ones involving inflation. When we indicate "nominal" estimates, we're referring to data that has not been adjusted to account for the corrosive effect of inflation of inflation. For household income data, that corresponds to the money the people living in a household with annualized earnings in the exact middle of the U.S. income distribution actually saw from their paychecks at the time they earned them. For example, if you traveled back in time to January 2000 and asked a person living that period's median income earning household how much their annual household income is, they would tell you $40,483. This data is more or less fixed - it does not change outside of revisions in our source data, which you've probably noticed if you've followed our charts for this series over time.
So called "real" median household income represents money that has been adjusted to account for the effect of inflation on its purchasing power over time. Using our example, January 2000's $40,483 is the equivalent of $73,314 in terms of July 2023's U.S. dollars after making that adjustment using the U.S. Consumer Price Index for All Urban Consumers. Alternatively, we could say that July 2023's initial nominal median household income estimate of $82,139 is the equivalent of $44,147 in terms of the U.S. dollars of January 2000. In our charts, this data changes every month when we present median household income estimates that are adjusted to be expressed in the terms of the U.S. dollars of the month of the newest estimate, which happens to also be the nominal median household income figure for the month we're reporting.
Next month, that inflation adjusted data will be expressed in terms of August 2023's U.S. dollars.
For the latest in our coverage of median household income in the United States, follow this link!
If you're curious how we generate our estimates of median household income, we last updated our methodology in March 2022 following a much more substantial revision of aggregate income data. We also periodically compare our estimates with other nominal estimates, which we'll update sometime in the next month.
References
U.S. Bureau of Economic Analysis. Table 2.6. Personal Income and Its Disposition, Monthly, Personal Income and Outlays, Not Seasonally Adjusted, Monthly, Middle of Month. Population. [Online Database (via Federal Reserve Economic Data)]. Last Updated: 31 August 2023. Accessed: 31 August 2023.
U.S. Bureau of Economic Analysis. Table 2.6. Personal Income and Its Disposition, Monthly, Personal Income and Outlays, Not Seasonally Adjusted, Monthly, Middle of Month. Compensation of Employees, Received: Wage and Salary Disbursements. [Online Database (via Federal Reserve Economic Data)]. Last Updated: 31 August 2023. Accessed: 31 August 2023.
U.S. Department of Labor Bureau of Labor Statistics. Consumer Price Index, All Urban Consumers - (CPI-U), U.S. City Average, All Items, 1982-84=100. [Online Database (via Federal Reserve Economic Data)]. Last Updated: 10 August 2023. Accessed: 10 August 2023.
Image credit: Photo by Clay Banks on Unsplash.

