How much has the average cost of attending college at four-year degree-granting institution in the U.S. risen since the 1969-1970 school year?
For an American student who enrolled in a four-year college in the fall of 1969, the average they paid for their tuition, required fees, room and board totaled $754, which when we adjust for inflation be be in terms of constant 2011 U.S. dollars, works out to be the near modern day equivalent of $4,619.
But a student enrolling in the same kind of institution in the fall of 2011 for the 2011-2012 school year would pay $13,608. Nearly three times as much.
To get a better sense of how affordable, or rather, unaffordable attending college has become, we next calculated the percentage that the average cost of tuition and fees for college would consume of the typical income earned by American households:
In the chart above, we see that after holding basically flat from 1969 through 1982 at a range between 8.6% and 9.0% of the median American household income, the ratio of the cost of attending college with respect to that income began rising rapidly, with the cost of college having reached 26.7% of the American median household income in 2011-2012.
We also see that there would appear to be certain periods where the cost of attending college rose considerably faster than median household incomes, which we've shaded in the chart above.
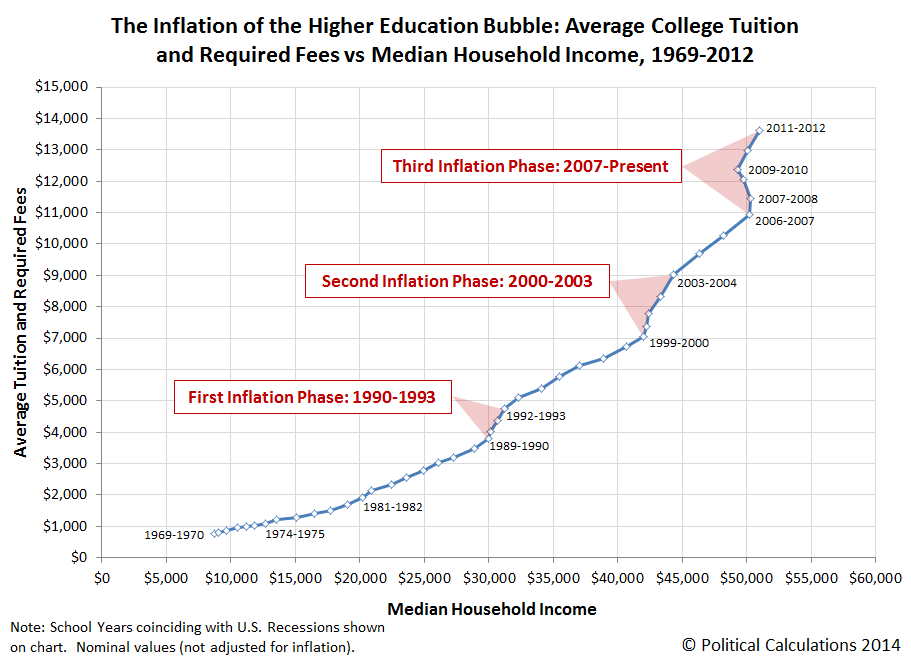
Let's next look at how the cost of attending college has grown against median household incomes from 1969 through 2012:
Here, we see that there have been three major inflation phases for the cost of college: the first running from 1990 to 1994, the second from 2000 to 2003 and the third from 2007 through at least 2012 (and likely, the present).
We should note that each of these periods coincide with periods of recession or extended underperformance for the U.S. economy. But what is perhaps more remarkable is that we do not observe the same pattern for earlier recessions, the major years for which we've also indicated on this third chart.
That's largely the role of increased government subsidies for higher education after 1989, in the form of grants and guarantees for student loans, which enabled colleges to continue jacking up their prices well above what a typical American household could afford to pay, because now Uncle Sam is increasingly stepping in to pay a growing share of the bill.
References
National Center for Education Statistics. 2012 Digest of Education Statistics. Table 381. Average undergraduate tuition and fees and room and board rates charged for full-time students in degree-granting institutions, by level and control of institution: 1969-1970- through 2011-12. [Excel Spreadsheet]. NCES 2014-015, December 2013.
U.S. Census Bureau. 2013 Current Population Survey. Annual Social and Economic Supplement. Table H-5. Race and Hispanic Origin of Householder--Households by Median and Mean Income: 1967 to 2012. [Excel Spreadsheet]. P60-245, September 2013.
Bureau of Labor Statistics. Consumer Price Index - All Urban Consumers. U.S. City Average, All Items, Not Seasonally Adjusted. Online Application]. Accessed 8 March 2014.
Previously on Political Calculations
- The Next Scary Hockey Stick Chart
- The Rising Unaffordability of a College Education
- How Much Do Public School Teachers Really Make Compared to Private School Teachers?
- The Math They Forgot or, More Likely, Were Never Taught
- Ranking School Smarts by Major, Updated
- The Educated and the Unemployed
- U.S. Spending for Higher Education Since 1962
- Forecasting the Cost of College
- Correlating Federal Spending and College Tuition
- Who's Behind the U.S. Higher Education Bubble?
- Visualizing the U.S. Higher Education Bubble
- How Much Money Will You Earn in Your Lifetime?
- What Kind of Job Can You Hope to Get With Your Education?
- Does It Pay to Go to Law School?
- The Eureka Experiment
- Milking the Cash Cows of College
- Should You Send Your Child Away to College?
- Highly Questionable Higher Education Costs
- Subsidizing Low Value Majors
- Keeping the Cost of College Down
- Does Financial Aid Drive College Costs Up?
- Math, Science, Students, Teachers
- Saving for College
- Your Student Loan
- The Transformation of Student Loans Into Taxes
- Transforming Student Loans from Taxes Back into Debt
- The Contribution of Student Loans to the U.S. National Debt


