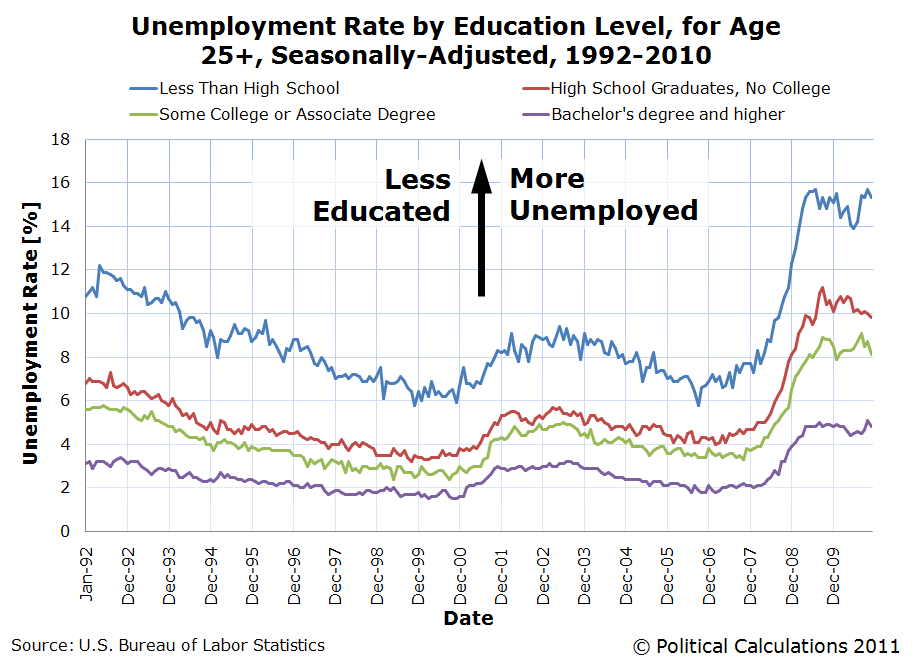
Does more education equal lower unemployment?
As our chart below shows, those with higher levels of education would seem to have lower levels of unemployment, at least if we go by unemployment rates over time.

But does it really?
Since January 1992, the number of people in the civilian labor force for each education level has changed as shown in the table below (the BLS doesn't break this particular data out for those with either Some College or Associate degrees):
| Size of Civilian Labor Force by Education Level, January 1992 and December 2010 | |||
|---|---|---|---|
| Education Level | January 1992 | December 2010 | Percentage Change |
| Less Than High School | 13,756,000 | 11,758,000 | -14.5% |
| High School Graduate (No College) | 37,809,000 | 38,203,000 | +1.0% |
| Bachelor's Degree or Higher | 27,632,000 | 46,312,000 | +67.6% |
Now, let's approximate how many individuals Age 25 or older would be counted as being unemployed in both January 1992 and in December 2010 if the December 2010 unemployment rate applied at both times:
| Equivalent Number of Unemployed by Education Level, January 1992 and December 2010, If December 2010 Unemployment Rate Applied at Both Times | |||
|---|---|---|---|
| Education Level | December 2010 Unemployment Rate | Equivalent January 1992 Unemployed | Approximate December 2010 Unemployed |
| Less Than High School | 15.3% | 2,104,668 | 1,798,974 |
| High School Graduate (No College) | 9.8% | 3,705,282 | 3,743,894 |
| Bachelor's Degree or Higher | 4.8% | 1,326,336 | 2,222,976 |
| Combined Totals | N/A | 7,136,286 | 7,765,844 |
What we discover is that thanks to the 67.6% increase in the number of individuals in the U.S. civilian labor with Bachelor's degrees from 1992 to 2010, the apparently lower unemployment rate of those with Bachelor's degrees is masking the fact that significantly more people with Bachelor degrees are unemployed today than would have been the case 18 years ago with an identical unemployment rate.
We also find that despite a much higher unemployment rate, the much lower number of people with less than a high school education today means that fewer of these individuals are being counted as unemployed as compared to 1992 if the same unemployment rate applied then.
Meanwhile, with a nearly static representation in the U.S. workforce between 1992 and 2010, we find that high school graduates without any college education would have little difference in the unemployment figures. If you ran into an unemployed individual at random, you'd have about the same 1 out of 2 chance of doing that today as you would have had then for our presented data.
Altogether, what these demographic changes indicate for our presented data is that if you were to meet an unemployed individual at random today, you would have a nearly a 1 out of 3 chance of running into one with a Bachelor's degree. In 1992, the odds of that happening would have been 1 out of 5, even if the same unemployment rate applied.
So, believe it or not, those with higher levels of education are more likely to be among the unemployed today than would have been the case almost two decades ago!
Previously on Political Calculations
Data Sources
U.S. Bureau of Labor Statistics. Labor Force Statistics. Current Population Survey (CPS). Age 25 or older, by selected education level, seasonally-adjusted, 1992-2010. Accessed 28 January 2011.
Labels: demographics, education, math, unemployment
Welcome to the blogosphere's toolchest! Here, unlike other blogs dedicated to analyzing current events, we create easy-to-use, simple tools to do the math related to them so you can get in on the action too! If you would like to learn more about these tools, or if you would like to contribute ideas to develop for this blog, please e-mail us at:
ironman at politicalcalculations
Thanks in advance!
Closing values for previous trading day.
This site is primarily powered by:
CSS Validation
RSS Site Feed
JavaScript
The tools on this site are built using JavaScript. If you would like to learn more, one of the best free resources on the web is available at W3Schools.com.