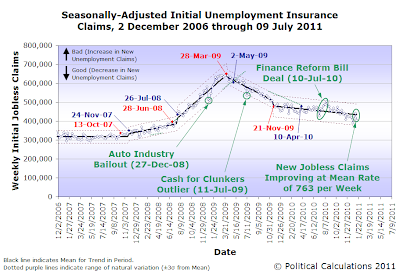
Specifically, we were wrong when we speculated back on 29 November 2010 that the trend in new jobless claims that has existed since 21 November 2009 might be breaking down.

At the time, we were optimistic that the sudden decline in the number of weekly jobless claims that coincided with the first week that employers would have been able to alter their employee staffing and retention plans following the U.S. election results of 2 November 2010.
Using our "control chart" method of analyzing new jobless claims data, we would have recognized that to be the case if the weekly number of jobless claims had moved and stayed below the statistically-determined lower "control limit" line.
Instead, the data in subsequent weeks continued to fall within the boundaries of the statistical limits defined by the trend we've observed since November 2009, when the introduction of HR 3962, the legislative precursor of the Patient Protection and Affordable Care Act, derailed the then rapidly improving trend in the rate of layoffs in the U.S. as employers reacted to the increased likelihood of having higher costs imposed upon their businesses by the proposed health care reform law going forward.
What we find then is that the weekly number of new jobless claims are continuing to follow a slow, but positive downward trend, with the variation we observe being the result of what we would consider to be common causes - the kind of variation that we would likely see occurring naturally as employers respond to a variety of typical daily business events, such as weather conditions. These kinds of events may have a small impact from week to week, but not a large enough impact that can significantly affect an overall trend.
As for the overall trend that we do observe, the average rate at which the number of new unemployment insurance claims are being filed is falling is approximately 763 per week, which means that from the initial estimate of 404,000 new jobless claims that were filed this week, it will take an additional 110 weeks, or 2.1 years, for the amount of weekly new unemployment insurance claim filings claims to equal the average 319,711 per week that was typical for the U.S. economy prior to the 2007 recession.
That's a long time before the number of layoffs, the events that directly lead to the new unemployment insurance claim filings that the government tracks, would go back to levels that are consistent with a comparatively healthy U.S. economy.
Labels: jobs
Welcome to the blogosphere's toolchest! Here, unlike other blogs dedicated to analyzing current events, we create easy-to-use, simple tools to do the math related to them so you can get in on the action too! If you would like to learn more about these tools, or if you would like to contribute ideas to develop for this blog, please e-mail us at:
ironman at politicalcalculations
Thanks in advance!
Closing values for previous trading day.
This site is primarily powered by:
CSS Validation
RSS Site Feed
JavaScript
The tools on this site are built using JavaScript. If you would like to learn more, one of the best free resources on the web is available at W3Schools.com.