Political Calculations
January 11, 2011

The boss1, in his usual pithy way, sets the stage:

OBAMA MATH: $250,000/year for a couple is "rich," but $172,000/year for a White House flunky is "relatively modest."

It occurs to us that we have the ideal tool to determine where, by President Obama's standards, the annual income needed to be considered "rich" begins. Or perhaps more appropriately, the annual income the President believes to be where "relatively modest" ends! We ran it with both $172,000 and $250,000 entered into it, which we're including here so you can get directly in on the fun too!

2009 Cumulative Income Distribution for the United States for Individuals Age 15+

Annual Income Data
Input Data Values
Your Annual Income (Total Money Income)


Your Income Percentile Ranking
Calculated Results Values
Your Income Percentile
Approximate Number of Americans Who Earn Your Income or Less
Approximate Number of Americans Who Earn More Than You

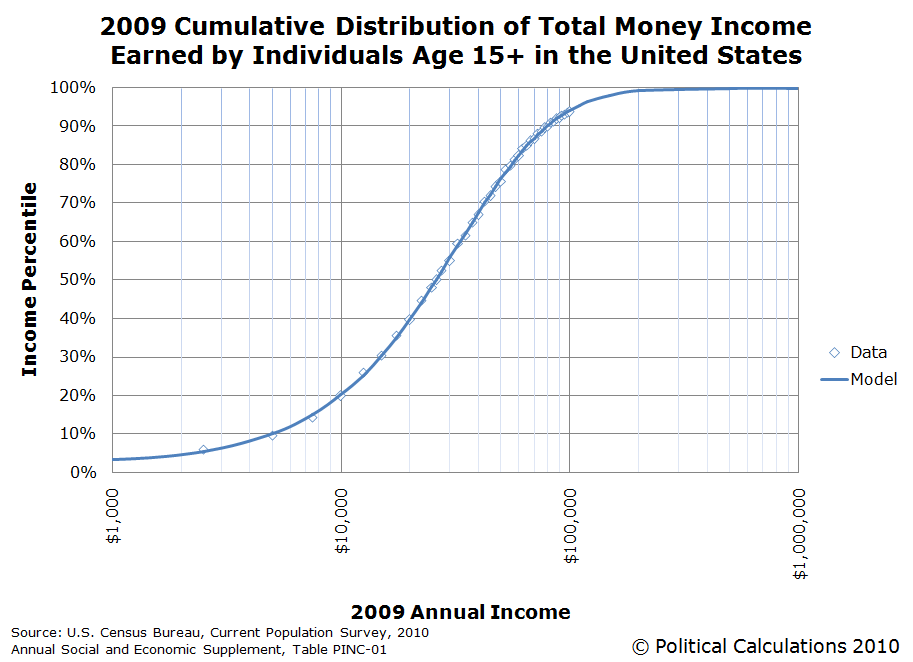
Using the tool, we find that an individual with an income of $172,000 would be in the 98.35th percentile of all individual income earners in the United States (at least, in 2009), while an individual with an income of $250,000 would earn more income than 99.48% of all income-earning Americans.

By contrast, the median annual income for individuals in the U.S. in 2009, the most recent year for which the U.S. Census has reported this data, is $26,134. The median income is, by definition, the amount of money that 50% of all income earning Americans either made less than or made more than during 2009. (Note: our tool slightly overestimates the median mark, estimating it to be $26,260.)

But wait! That doesn't take into account the super "cushy" benefits that government employees enjoy. The ones that, in 2008, averaged $40,785 per federal government employee. That compares with the average $9,882 amount of annual compensation benefits enjoyed by typical Americans.

Adding that average benefit value onto the President's idea of a "relatively modest" annual salary of $172,000 produces a combined annual compensation amount of $212,785. Plugging that number into the tool above suggests that this amount of compensation is higher than that of 99.11% of all Americans!

So, by the President's standards, people who earn more money than 99.11% of all other Americans are people with "relatively modest" incomes.

Expressed differently, this result indicates that an individual can be counted among the Top 1% of all individual income earners in the United States and still be considered to be earning a "relatively modest" income by President Obama.

Coincidentally, according to John Quiggin, the total amount of income earned by all individuals included among the Top 1% of U.S. income earners is about equal to the amount of government spending planned by President Obama!

We stand by our basic assessment that Barack Obama is not a smart man when it comes to money. And quite possibly, if we consider the amount of spending he plans and combine those very large numbers with this discovery of how human perception of values becomes distorted when very large numbers become disconnected from any sense of scale on a human level, we can perhaps finally understand why.


1 Not really (check the date of the linked post to understand why!) But please do copy and paste the permalink for this post for use in the tool in the linked post if you'd like to incorporate the resulting Instapundit-style HTML code into your own blog post!

Labels: ,


<< Home
Unexpectedly Intriguing!

About Political Calculations


blog advertising
is good for you

Welcome to the blogosphere's toolchest! Here, unlike other blogs dedicated to analyzing current events, we create easy-to-use, simple tools to do the math related to them so you can get in on the action too! If you would like to learn more about these tools, or if you would like to contribute ideas to develop for this blog, please e-mail us at:

ironman at politicalcalculations.com

Thanks in advance!

Recent Posts

Jobs: Stalled Out in 2010

On the Moneyed Midways - The Best Blogs We Found i...

A Rising Empire?

Worst. Recession. Jobs. Recovery. Ever.

Inside an Impossible Prediction for the S&P 500

Your Paycheck in 2011

Visualizing Friendships: The World According to Fa...

The Future for Dividends in 2011

The Full Deployment of the World's Eighth Largest ...

Should You Get Married?

Elsewhere on the Web

This year, we'll be experimenting with a number of apps to bring more of a current events focus to Political Calculations - we're test driving the app(s) below!

Most Popular Posts

The S&P 500 at Your Fingertips

The Distribution of Income for 2010: Individuals

Should You Trade in Your Gas Guzzler?

What Are the Chances Your Marriage Will Last?

Tipping Around the World

What's Your Body Fat Percentage?

The Odds of Dying, Again!

Gas Prices, the Unemployment Rate, and Desperation

Hauser's Law

The Real Story Behind "Rising" U.S. Income Inequality

Quick Index

First Time Visitor to Political Calculations?

On the Moneyed Midways

A Lot, But Not All, of Our Tools

U.S. GDP Temperature Gauge

Political Calculations' GDP Temperature Gauge, 2013Q1 First Estimate Political Calculations' U.S. GDP Temperature Gauge provides a means to quickly evaluate the growth rate of the U.S. economy against the backdrop of how the economy has performed since 1980, with the "temperature" color spectrum ranging from a recessionary "cold" (purple) through an expansionary "hot" (red).

The GDP Temperature Gauge presents both the annualized GDP growth rate as reported by the U.S. Bureau of Economic Analysis reports for a one-quarter period and also as averaged over a two quarter period, which smooths out the volatility seen in the one-quarter data and provides a better indication of the relative strength of the U.S. economy over time.

Site Data

This site is primarily powered by:

This page is powered by Blogger. Isn't yours?

Visitors since December 6, 2004:

CSS Validation

Valid CSS!

RSS Site Feed

AddThis Feed Button

JavaScript

The tools on this site are built using JavaScript. If you would like to learn more, one of the best free resources on the web is available at W3Schools.com.

Other Cool Resources

ZunZun - Exceptional regression analysis tool.
Wolfram Integrator - Solve integrals. Do calculus!
Create a Graph - Easy-to-use basic graph-making tool.
Many Eyes - Data visualization extraordinaire!
Wolfram Alpha - Computational knowledge engine.
Khan Academy - Math & science video mini-lectures!
Picasion - Animate images.


Archives
December 2004
January 2005
February 2005
March 2005
April 2005
May 2005
June 2005
July 2005
August 2005
September 2005
October 2005
November 2005
December 2005
January 2006
February 2006
March 2006
April 2006
May 2006
June 2006
July 2006
August 2006
September 2006
October 2006
November 2006
December 2006
January 2007
February 2007
March 2007
April 2007
May 2007
June 2007
July 2007
August 2007
September 2007
October 2007
November 2007
December 2007
January 2008
February 2008
March 2008
April 2008
May 2008
June 2008
July 2008
August 2008
September 2008
October 2008
November 2008
December 2008
January 2009
February 2009
March 2009
April 2009
May 2009
June 2009
July 2009
August 2009
September 2009
October 2009
November 2009
December 2009
January 2010
February 2010
March 2010
April 2010
May 2010
June 2010
July 2010
August 2010
September 2010
October 2010
November 2010
December 2010
January 2011
February 2011
March 2011
April 2011
May 2011
June 2011
July 2011
August 2011
September 2011
October 2011
November 2011
December 2011
January 2012
February 2012
March 2012
April 2012
May 2012
June 2012
July 2012
August 2012
September 2012
October 2012
November 2012
December 2012
January 2013
February 2013
March 2013
April 2013
May 2013

Blog Roll

Bloodhoundblog
Budgets Are Sexy
Cafe Hayek
Carpe Diem
Core77
Coyote Blog
Craig Harper
Darwin's Finance
Digerati Life, The
Division of Labour
Dough Roller, The
Eclectecon
Econlog
Economics Roundtable
EconomicsUK
Environmental Economics
Escape from Cubicle Nation
Execupundit
FiscalGeek
Get Rich Slowly
Gongol
Good Financial Cents
HR Bartender
Hot Air
i4cp Productivity
Innocent Bystanders
Innovation and Growth
Instapundit
Intangible Economy
I've Paid Twice for This Already
Joanne Jacobs
Kaus Files
Len Penzo dot Com
Making Ripples
Market Power
Mechonomics
Mighty Bargain Hunter
Monevator
My Dollar Plan
New Economist
Newmark's Door
Nina Simosko
Physorg
Private Sector Development
Real Clear Politics
Richard Fernandez
Roger L. Simon
Rowan Manahan
Sound Politics
SOX First
Sports Economist, The
squawkfox
Three Star Leadership
Tim Worstall
Townhall
Trusted Advisor
Uncommon Misperceptions
voluntaryXchange
WILLisms
Winterspeak

Market Links

Big Picture, The
Crackerjack Finance
CXO Advisory Group
Disciplined Approach to Investing
Dividend Guy, The
Doug Short
Evidence Investing
Fat Pitch Financials
FX Investment Strategies
Oilprice

Charities We Support

American Red Cross
Children's Heart Foundation
Salvation Army
SMA Foundation

Recommended Reading

Kindle Paperwhite 3G - Best e-reader!
Angel in the Whirlwind
Bailout Nation
Cartoon Guide to Statistics
A Comprehensive Guide to the Peloponnesian War
The Complete Personal Memoirs of Ulysses S. Grant
The Count of Monte Cristo
Ender's Game
Gardner's Art Through the Ages
Empire of Wealth
How to Make Presentations to Councils and Boards
Juran's Quality Handbook
Marks' Standard Handbook
The Second World War
Stocks for the Long Run
Why Smart Executives Fail

Recommended Viewing

The Tudors: The Complete Series

Recently Shopped

Kindle Fire HD 8.9" 4G LTE Wireless 32 GB
Snap Circuits Jr. SC-100
Nerf Vortex Praxis
Sony BRAVIA 40" LED HDTV
2540 Series Docking Station
New Balance MX623
Dunham Men's Waterproof Oxford
TN360 Black Toner Cartridge
The Dangerous Book for Boys
Air Swimmer Remote Control Inflatable Flying Shark
Fisher-Price Little People Lil Pirate Ship

Seeking Alpha Certified