Georgetown University's Center on Education and the Workforce is out with its latest publication: Help Wanted: Projections of Jobs and Education Requirements Through 2018. The report, written by Anthony P. Carnevale, Nicole Smith and Jeff Strohl, attempts to forecast what kinds of jobs will be available in the future along with their education requirements, in an attempt to help today's high school and college students, along with working adults seeking career advancement, determine what kind of education they'll need to acquire to be able to find the kind of work they want to do in the future.
But doesn't the Bureau of Labor Statistics do this for us already? As it happens, they do, but not very well:
The United States is unable to help people match their educational preparation with their career ambitions—not because it cannot be done but because it simply is not being done. All the information required to align postsecondary educational choices with careers is available, but unused. The forecast in this report demonstrates that projecting education and job requirements is technically feasible with a minimum amount of error. But the current education projections by the Bureau of Labor Statistics (BLS), use a methodology that underestimates the demand for postsecondary education.
The authors compared the results of using their forecasting methodology against that used by the BLS in a 1998 forecast looking ten years ahead in time, finding that the BLS underestimated the number of jobs that would require at least some post-secondary education by 2008 by 47%, while their method overestimated the actual figure by 4%. In terms of raw numbers, the 4% error corresponds to about 2 million workers, while we estimate that the BLS' 47% discrepancy failed to account for the minimum education requirements needed by 23.5 million American workers.
The authors explain why relying upon the BLS' official projections might represent a major problem for today's students:
Unfortunately, the poor quality of the official projections cascades downward through state and local data systems into the hands of policy makers. These numbers are not the only factor that determines policy, but they are the only data available on the economy’s demand for postsecondary education. Because the official data consistently underestimate the demand for postsecondary education, they encourage a consistent bias against investing in postsecondary education and training. Ultimately, the official data misinform the educational choices and career plans of individuals and their counselors.
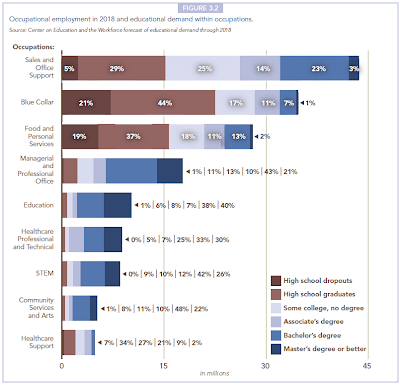
So what kind of education will the jobs of tomorrow require? The Georgetown study breaks it down graphically by occupational categories for what they expect for 2018:

In the chart above, STEM stands for Science, Technology, Engineering and Mathematics. Next, let's take a closer look at where the authors expect new and replacement job opportunities will be found in the years from the baseline year of 2008 through 2018:

So there you are - the types of jobs the United States is likely to produce through 2018 as well as the percentage share that will be filled by people with varying levels of education.
Is it time to go back to school, yet?
Welcome to the blogosphere's toolchest! Here, unlike other blogs dedicated to analyzing current events, we create easy-to-use, simple tools to do the math related to them so you can get in on the action too! If you would like to learn more about these tools, or if you would like to contribute ideas to develop for this blog, please e-mail us at:
ironman at politicalcalculations
Thanks in advance!
Closing values for previous trading day.
This site is primarily powered by:
CSS Validation
RSS Site Feed
JavaScript
The tools on this site are built using JavaScript. If you would like to learn more, one of the best free resources on the web is available at W3Schools.com.