How might a government go about increasing the amount of money it takes from its population without raising their taxes or visibly generating widespread inflation in the nation's economy?

The answer to that question could well be a corrupt politician's dream, because if they could get away with it, they could be seen as "holding the line" on both taxes and inflation while still fully funding and feeding their parasitic appetite for power.
In considering the explosive growth of the federal direct student loan program in the last two years, it occurred to us that these kinds of loans would be an ideal vehicle for corrupt politicians to extract more wealth from Americans than they ever could directly through income and payroll taxes alone.
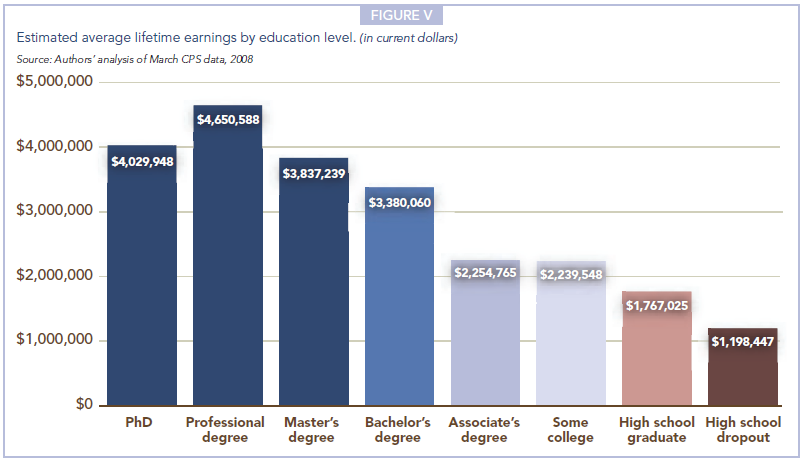
Here's why. People seeking college educations have three characteristics that would make them desirable as willing marks for this kind of corrupt political strategy. First, they are more likely to earn a lot more money than less educated individuals will over their lifetimes. This factor provides the motivation for both individuals to pursue higher education and for the government to support their doing so, because at a minimum, people who are likely to earn higher incomes will also be likely to pay higher taxes.
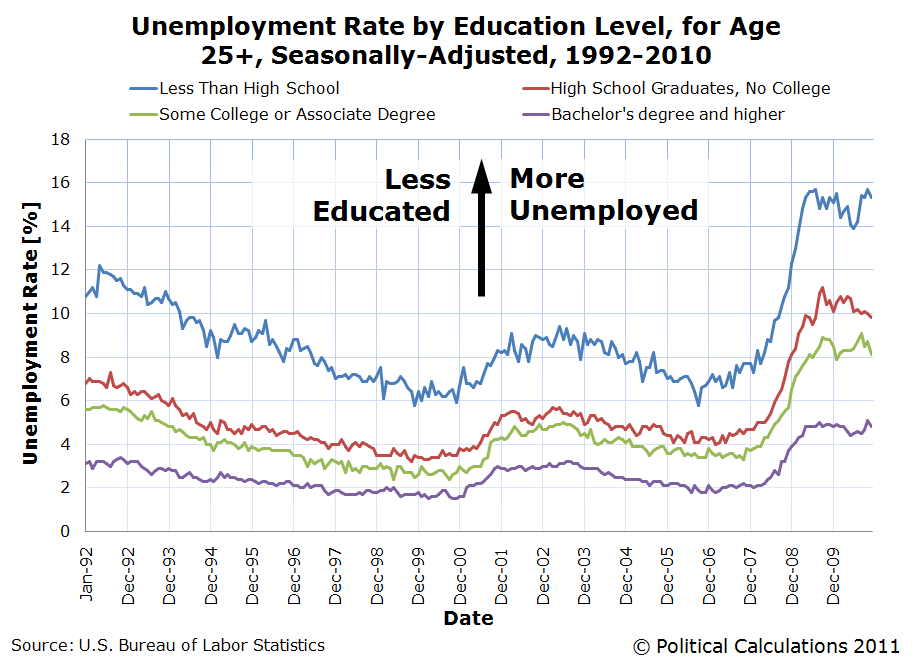
Second, they tend to be much less susceptible to becoming unemployed in economic downturns, at least if we go by unemployment rates. This relative employment stability then would be very attractive because it would translate into a more stable source of funding to support government spending programs.
Third, because debt is an inferior good, or rather, something that as incomes rise, the demand for it falls. Here, people seeking student loans to pursue higher educations predominantly fall in the lower and middle range of the income spectrum for the United States.

This is important when you consider how income is collectively distributed within the nation - the aggregate amount of income earned by individuals in these income ranges utterly dwarfs the collective incomes earned by the highest income earners. This characteristic would then makes these individuals highly attractive to corrupt politicians and bureaucrats for their money extraction efforts because, in words that famous bank robber Willie Sutton is alleged to have said, "that's where the money is".

By themselves, these first two characteristics would explain the government's desire to have a role in the financing of higher education. But it's the third characteristic that would provide the main motivation for the government to become a direct lender to students, and if possible, the only lender, thanks to how income taxes have evolved over time.

In the United States, approximately 47% of all income earning households pay no federal income taxes as a result of the combination of increasing tax deductions and tax credits that politicians have established over the years as part of their efforts to secure their elected positions, where in providing these breaks to the very numerous population of low-to-middle income earners, they appear to benefit these Americans at the expense of high income earning Americans.
But in doing that, they have prevented themselves from being able to directly raise taxes on this part of the electorate, because of the marginal effect that raising tax rates would have.
For instance, if the marginal income tax rates set to expire at the end of 2010 had not been extended, a lot of people at the lowest end of the income spectrum would have seen their income tax rates rise from 10% to 15% of their incomes.

That may not seem like a big change, but the amount of taxes many of these individuals would have had to pay to the government would have risen by 50%. As an example, for a taxable income of $10,000, the amount of taxes levied against that income would have risen from $1,000 to $1,500, a 50% increase in the amount of taxes owed to the government, as it would take away an additional 5% of a very low income from the individual who earned it.
That kind of move would be enough to put an elected politician's hold on their seat of power at risk, which is the primary unspoken reason why these income tax rates were extended in the lame duck session of the 111th U.S. Congress.
Unfortunately for these low-to-middle income earning individuals, that's also where the bulk of untaxed money is to be found in the United States. To get at that money, corrupt politicians are pushing hard into the direct student loan business in a very big way to get around the obstacle of raising taxes directly on this portion of the population. Even to the point of seriously jacking up the national debt to do it.

Their involvement, of course, extends far beyond just getting into the business of directly issuing student loans. The federal government has also:
- Contributed to the exponentially rising cost of tuition through:
- Increasing grants and subsidizing financial aid programs for low-income students, which increases the number of marginal students who will also require student loans to cover the cost of attending college.
- Subsidizing public higher education institutions so that they are effectively insulated from negative economic conditions.
- Impose high regulatory costs and compliance burdens on higher education institutions, which contribute to their increased costs to students.
- Sharply expanded the federal government's direct student loan programs to be available to individuals attending a widening range of higher education institutions directly through the federal government.
- Acted to prevent student loan debt from being discharged through bankruptcy, except under conditions of "undue hardship" that require the individual to demonstrate they are physically unable to work and have no chance of earning an income as a result.
- Closed off alternative paths into the U.S. workforce by increasing their costs. Having systematically increased the costs of employing individuals with lower levels of education, the federal government is effectively forcing an increasing number of young individuals onto the college track. Since many of these individuals would have chosen to work otherwise, these actions have increased the number of marginal students now seeking college educations.

Collectively, these actions avoid generating widespread inflation in the economy by tightly concentrating it within the market for higher education in the United States.
But those actions then make it necessary for an increasing number of individuals from low-to-middle income earning households to take out student loans in ever-increasing amounts to cover all or part of their cost of obtaining a college education. And also increasingly, from the one entity against whom they can never escape by defaulting on their loan payments, who also has the means to collect money owed to it from student loan recipients directly by taking their income tax refunds, garnishing their paychecks or even taking federal benefits such as Social Security away from the individual.
Thus are student loans transformed into taxes. In just about all but name.
Previously on Political Calculations
Your Student LoanLabels: national debt, taxes
Welcome to the blogosphere's toolchest! Here, unlike other blogs dedicated to analyzing current events, we create easy-to-use, simple tools to do the math related to them so you can get in on the action too! If you would like to learn more about these tools, or if you would like to contribute ideas to develop for this blog, please e-mail us at:
ironman at politicalcalculations
Thanks in advance!
Closing values for previous trading day.
This site is primarily powered by:
CSS Validation

RSS Site Feed
JavaScript
The tools on this site are built using JavaScript. If you would like to learn more, one of the best free resources on the web is available at W3Schools.com.
Other Cool Resources
Blog Roll


