Visual Capitalist's Niccolo Conte has created a new data visualization ranking nations according to their debt-to-GDP ratios. However, instead of only looking at their government debt as many others analysts have done, he's also broken out rankings for household and non-financial corporate debts as well for 43 of the world's biggest national economies.
Here's his summary of the top ranked nation for each category:
Debt can sit on very different parts of an economy’s balance sheet. In Japan, the largest burden sits with the government. In Switzerland, households stand out. And in Luxembourg, corporate borrowing towers over the size of the economy.
Here's the chart:

Conte describes what he found in creating the rankings:
Government debt is concentrated in Southern Europe and East Asia, with Greece (146.5%), Italy (137.1%), France (116.0%), Spain (100.7%), and Portugal (89.7%) all in the top 15 alongside Japan and Singapore (166.2%)....
Household debt is concentrated among wealthy economies with expensive housing and deep mortgage markets, led by Switzerland, Australia (114.0%), Canada (100.6%), the Netherlands (93.8%), and New Zealand (91.1%).
Corporate debt is especially high in Northern Europe and economies that host multinational financing structures. Luxembourg, Hong Kong, and Singapore (127.2%) all rank among the leaders.
Only three economies rank in the top 10 of more than one column: Canada, Hong Kong, and Singapore. Canada’s government (100.2%), households (100.6%), and companies (118.3%) each owe roughly a year of GDP, which is why the country ranks sixth on combined debt without leading any single category.
Conte finds unique conditions apply for both Singapore and Switzerland, which are near or are at the top of the government and household debt-to-GDP categories:
Singapore’s second-place government figure is not what it looks like. By law, the proceeds of Singapore Government Securities cannot be spent on the budget. Most are issued to the national pension fund and invested, leaving the state with more assets than debt and a AAA credit rating....
Switzerland’s position at the top of the household ranking is particularly notable because the country has one of Europe’s lowest homeownership rates.
For decades, Swiss tax law taxed homeowners on the imputed rental value of their homes while allowing them to deduct mortgage interest, which rewarded keeping a mortgage rather than paying it down. Voters abolished that system in September 2025, with the change taking effect no earlier than 2028.
How many other countries have similarly strange and perverse incentives for their households and corporations to rack up debt?
Reference
Nicholas Conte. Ranked: Countries With the Highest Debt-to-GDP Ratios. [Online article, Infographic]. Visual Capitalist. 8 September 2026.
Labels: data visualization, national debt


Social Security's trustees released their 2026 report on what they expect for the future of the program. As with just about every one of their reports over the last decade, they foresee big benefit cuts when the program's Old Age and Survivors Insurance (OASI) Trust Fund is depleted.
The main changes in this year's report affect the timing of when the trust fund runs out of money and how big the benefit cuts will be after it does. The year of reckoning moved up to the end of 2032 from sometime in 2033, which if they divert money from the program's Disability Insurance (DI) program to it, could last until 2034.
Meanwhile, the magnitude of retirement benefit cuts when the trust fund no longer has any legal claim to money it "loaned" to the U.S. government while it had a surplus will be less than previously projected. Those cuts still aren't small - anyone receiving Social Security benefits will take a 22% hit to them. If they divert the DI trust fund money to keep the retirement benefits train going however, the cuts will be reduced to 17%.
Here is the trustees' official grim outlook:
- The OASI Trust Fund is projected to become depleted in the fourth quarter of 2032, one quarter earlier than projected in last year’s report. Upon reserve depletion in 2032, projected income is sufficient to pay 78 percent of scheduled benefits. This percentage declines gradually to 62 percent by 2100.
- DI Trust Fund reserves are projected to remain positive throughout the 75-year projection period, as was projected in last year’s report.
- The combined OASDI fund is projected to become depleted in the third quarter of 2034, the same quarter as in last year’s report. Upon reserve depletion in 2034, projected income is sufficient to pay 83 percent of scheduled benefits. This percentage declines gradually to 65 percent by 2100.
Social Security has been draining the OASI Trust Fund since 2010. The 2026 Trustees report indicates how big that deficit has been in every year from 2010 through 2025. We tallied up those deficits to find out how much the OASI Trust Fund has shrunk over those years, which we visualized in the following chart:

Through 2025, the OASI Trust Fund has cumulatively shrunk by $1.321 trillion. That's a lot of money, especially when you consider the U.S. government never had the cash to pay back the money it "owes to itself". Instead, it borrowed it, exchanging the debt it supposedly owed to itself for debt it owes to the public.
That raises a question. How much of the total U.S. national debt has gone from being counted as money the government owes to itself to instead be money the government owes to the public, which includes everyone from individual Americans who bought a savings bond to institutions like banks and insurance companies and foreign entities that loan money to the U.S. government by the truckload?
The answer to that question is visually presented in the next chart:

When you hear about Social Security's Trust Fund as being little more than an "accounting fiction", this transformation of debt from money the government owes to itself to be money the U.S. government owes to the public is what they mean. The trust fund debt is unavoidably becoming a general obligation of U.S. taxpayers, which is what it always was and is what it could only ever be.
Image credit: Microsoft Copilot Designer. Prompt: "An editorial cartoon of Uncle Sam pulling money from one of his pockets to put into another pocket while reaching behind himself to borrow money from a banker". From the looks of things, he's gotten himself really twisted up!
Labels: ideas, national debt
When the U.S. government's 2025 fiscal year ended on 30 September 2025, its total public debt outstanding totaled $37,637,553,494,935.61. Or to say it more simply, 37.638 trillion dollars.
From the end of its 2024 fiscal year, the nation's national debt increased by $2.173 trillion, or by about 6.1%, from its 2024 fiscal year end total. Believe it or not, that's an improvement over the previous year, which had seen the nation's public debt rise by over $2.297 trillion, or 6.9%, from how big it was at the end of its 2023 fiscal year.
All of these are gigantic numbers. We can put them into a more human scale by dividing the U.S. national debt among the nation's estimated 134,800,000 households. Divided equally, each household would see $279,210 added on top of all their other debt.
That's just a little more than the asking price for a 940 square foot apartment with one bedroom and one bathroom in Staten Island, New York. Imagine if your household borrowed $279,210 to buy that property at that price in addition to paying for your current residence. Now imagine 134,800,000 other U.S. households borrowing $279,210 each to buy an identical property for the same price.
You would have to borrow that money from somewhere, and in the case of the U.S. government, it's a little more complicated than going to the local bank. To whom does the U.S. government owe $37.638 trillion?
The following chart provides a first estimate of who the U.S. government's biggest creditors are at the end of its 2025 fiscal year, along with the portion of the national debt they are owed.

It will be months before all the numbers for 2025 are finalized. This chart presents a first estimate of who owns the U.S. national debt, which should be within a few tenths of a percent for most of the major holders of debt securities issued by the U.S. government.
The Overall Picture
The U.S. Federal Reserve is once again the U.S. government's single largest creditor holding U.S. government-issued debt securities worth 11.2% of the U.S. government's entire total public debt outstanding. However, its share of the national debt is down from the 18.3% it held in 2022 and the 12.4% recorded last year as the Federal Reserve has continued reducing its holdings. In doing so, the Fed is still following the monetary policy of shrinking its balance sheet that it initiated in March 2022 when it began hiking interest rates to combat inflation unleashed by President Biden's policies.
In terms of total share, U.S. individuals and institutions such as banks, insurance companies, investment funds, corporations, and individuals collectively increased their share of the national debt from 48.8% in 2024 to 50.4% in 2025.
Social Security's share of the national debt plunged from 7.3% in 2023 to 6.4% in 2024. This decline coincides with the ongoing depletion of its Old Age and Survivors Insurance trust fund, which has run in the red in every year since 2009.
The combined share of the U.S. national debt held by the government's military (4.8%) and civilian (2.9%) employee retirement trust funds grew from 7.5% to 7.7% from FY 2024 to FY 2025.
Altogether, the portion of the U.S. national debt held by U.S. entities in 2024 is 75.7%, a small dip from the 76% in 2024.
Foreign Holdings
The portion of the U.S. total public debt outstanding held by foreign individuals and institutions is 24.3%, which is up from the 24.0% recorded a year earlier.
The share of the national debt held by Japan and China, the two largest foreign holders of U.S. government-issued debt securities, declined. Japan's share fell from 3.2% to 3.1% from 2024 to 2025. China and Hong Kong's combined share likewise dipped from 2.8% to 2.6%.
Other nations' institutions, which have individually lent the U.S. government much smaller amounts of money than those of Japan and China, have collectively increased their lending to the U.S. national government over the past year.
About the Data
The U.S. government's total public debt outstanding is the value recorded for 30 September 2025, the final day of the government's 2025 fiscal year, which also applies for the portion of the national debt held by the government-operated trust funds for Social Security, military and civilian government employees. Data for foreign holdings is based on estimates through July 2025 that was available on 17 October 2025. The Federal Reserve's holdings are those recorded on 24 September 2025.
Labels: national debt
When Joseph Robinette Biden Jr. was sworn into office as the President of the United States on 20 January 2021, the U.S. national debt stood at $27.75 trillion. Four years later, as President Biden departs from office, the U.S. national debt was sitting at $36.21 trillion. The national debt increased by $8.46 trillion, or 30.5%, in those four years.
Because the concept of trillions of dollars of debt is difficult to comprehend in human terms, it's easier to understand the impact of President Biden's national debt legacy by dividing the national debt equally among all the households in the United States.
When we do that math, 2021's national debt total of $27.75 trillion becomes $216,050, which represents the national debt burden per household before any of President Biden's spending initiatives were implemented.
After four years of President Biden's spending initiatives, we find the household burden of 2025's national debt total of $36.21 trillion is $273,844. The burden of the national debt per household has increased by $57,724, or 27%, during President Biden's tenure.
The following chart reveals the level of the household burden of the national debt at each of President Biden's anniversaries in the White House. In it, we've also shown how much of the nation's debt is owed to its creditors by major category.

Remarkably, even though former President Biden came into office during a time of national emergency with the coronavirus pandemic and the severe economic disruption of state and local government-mandated lockdowns, most of the increase in the national debt during his tenure occurred during the final two years of his administration, after the pandemic had ended.
Altogether, while President, the $57,724 increase in the national debt burden per household is nearly enough for the government to give every household in the U.S. a Certified Pre-Owned 2024 Lexus RX 350 Premium Plus with low mileage. Because the U.S. government borrowed that money, you would have to add that debt to all your other household debt. Including your mortgage or rent, your credit card bills, every other vehicle loan you might have, and more.
By comparison, the increase in the national debt per household since Joe Biden became President was only enough to buy a brand new 2024 Toyota RAV4 Hybrid. Even used, the 2024 Lexus RX 350 Premium Plus is definitely a luxury upgrade.
Do you feel like you got that kind of luxury upgrade from four years of Joe Biden's debt-fueled spending? Did the U.S. government give you the equivalent of a shiny, almost-new red Lexus RX-350? If the government didn't buy you the equivalent of a Lexus for your household, at least you can enjoy paying it off over time, either through your taxes or through Joe Biden's incredibly persistent inflation.
References
U.S. Census Bureau. Historical Households Tables. Table HH-1. Households by Type: 1940 to Present. [Excel Spreadsheet]. Accessed 22 January 2025.
U.S. Treasury Department. Debt to the Penny. [Online Database]. 17 January 2025. Accessed 22 January 2025. Note: As 20 January 2025 fell on the Martin Luther King Jr. holiday, when the U.S. Treasury Department's debt window was closed with no changes to the national debt taking place, the national debt recorded for Friday, 17 Janaury 2025 is the appropriate reference for the end of President Biden's fourth year in office.
U.S. Treasury Department. Major Foreign Holders of Treasury Securities. [Online Data]. Accessed 22 January 2025.
U.S. Treasury Department. Monthly Treasury Statement of Receipts and Outlays of the United States Government for Fiscal Year 2025 Through December 31, 2024. [PDF Document]. 14 January 2025.
Labels: national debt, personal finance
The U.S. national debt is a truly large number. With the nation's total public debt outstanding of $35,464,673,929,171.69 as of the end of its fiscal year on 30 September 2024, the U.S. government is truly indebted to its major creditors.
During FY 2024, the U.S. national debt increased by $2.3 billion, or 6.9%, to reach that number. The national debt at the end of FY 2023 was just $33.167 trillion.
So to whom does the U.S. government owe $35.465 trillion?
The following chart provides a first estimate of who the U.S. government's biggest creditors are at the end of its 2024 fiscal year, along with the portion of the national debt they are owed.

It will be months before all the numbers for 2024 are finalized. This chart presents a first estimate of who owns the U.S. national debt, which should be within a few tenths of a percent for most of the major holders of debt securities issued by the U.S. government.
The Overall Picture
The U.S. Federal Reserve is once again the U.S. government's single largest creditor holding U.S. government-issued debt securities worth 12.4% of the U.S. government's entire total public debt outstanding. However, its share of the national debt is down from the 18.3% it held in 2022 and the 15% recorded last year as the Federal Reserve has continued reducing its holdings. In doing so, the Fed is still following the monetary policy of shrinking its balance sheet that it initiated in March 2022 when it began hiking interest rates to combat inflation unleashed by President Biden's policies.
Speaking of interest rates, on 19 September 2024, the Federal Reserve initiated a new series of interest rate reductions after holding them steady at an elevated level for over a year. Those higher rates have attracted U.S. individuals and institutions such as banks, insurance companies, investment funds, corporations, and individuals to collectively increase their share of the national debt from 47.1% in 2023 to 48.8% in 2024.
Social Security's share of the national debt plunged from 8.1% in 2023 to 7.3% in 2024. This decline coincides with the ongoing depletion of its Old Age and Survivors Insurance trust fund, which has run in the red in every year since 2009.
The combined share of the U.S. national debt held by the government's military (4.5%) and civilian (3.0%) employee retirement trust funds swelled from 7.2% to 7.5% from FY 2023 to FY 2024.
Altogether, the portion of the U.S. national debt held by U.S. entities in 2024 is 76.0%, a small dip from the 77.4% in 2023, but up slightly from 75.7% share in 2022.
Foreign Holdings
The portion of the U.S. total public debt outstanding held by foreign individuals and institutions is 24.0%. While this is not the largest percentage of the national debt that foreigners have ever held, the amount of their holdings is at a record level. Reuters describes the mid-2024 surge in those holdings:
Foreign holdings of U.S. Treasuries surged to a record high in August, data from the Treasury Department showed on Thursday, rising for four straight months.
Holdings of U.S. Treasuries by foreigners rose to $8.503 trillion in August, up from $8.338 trillion in the previous month. They were up 11.5% from holdings a year earlier.
And yet the share of the national debt held by Japan and China, the two largest foreign holders of U.S. government-issued debt securities, declined. Japan's share fell from 3.3% to 3.2% from 2023 to 2024. China and Hong Kong's combined share likewise dipped from 2.9% to 2.8%.
In fact, most of the increase in foreign holdings was driven by nations with a much smaller share of the U.S. national debt, with the category in which we group "all other foreign nations" rising from 11.7% in 2023 to 12.9% in 2024.
About the Data
The U.S. government's total public debt outstanding is the value recorded for 30 September 2024, the final day of the government's 2024 fiscal year, which also applies for the portion of the national debt held by the government-operated trust funds for Social Security, military and civilian government employees. Data for foreign holdings is based on estimates through August 2024 that was released on 17 October 2024. The Federal Reserve's holdings are those recorded on 25 September 2024.
Labels: national debt

When President Biden was sworn into office on 20 January 2021, the U.S. national debt stood at $27.75 trillion. Three years later, as President Biden celebrated his third anniversary in the White House, the U.S. national debt was sitting at $34.07 trillion. That's an increase of 6.32 trillion dollars or 22.8% in three years.
These are all very big numbers that are hard to appreciate on a human scale. But they become a lot easier to understand when we divide them up equally among all the households in the United States.
When we do that math, 2021's national debt total of $27.75 trillion becomes $216,050, which represents the national debt burden per household before any of President Biden's spending initiatives were implemented.
Three years of President Biden's spending initiatives later, we find the household burden of 2024's national debt total of $34.07 trillion is $259,235. The burden of the national debt per household has increased by $43,185, or 20%, during President Biden's three years in office.
The following chart shows the level of the household burden of the national debt at each of President Biden's anniversaries in the White House. In it, we've also shown how much of the nation's debt is owed to its creditors by major category.

The year-over-year increase in the national debt burden per household in President Biden's third year in office is the largest of his presidency.
Keeping the discussion at the human scale, last year, we found that the increase in the national debt through President Biden's first two years in office would be enough to pay for what was then a brand new 2023 Suburu Impreza.
One year later, we find the national debt increase under President Biden is almost the equivalent of buying a brand new 2024 Toyota RAV4 Hybrid for every one of the estimated 131,434,000 households in the United States. Plus an extra $137 in cash. As automobiles go, it sounds like an upgrade and who doesn't like the idea of the government borrowing money if it means you get cash too?
But do you feel like your household has received that much value from three years worth of President Biden's debt-fueled spending? And how well does that extra debt fit with all the other debts your household has? Can your household afford that extra debt bill on top of all the others?
Exit question: What kind of car do you think President Biden's contributions to the national debt burden per household would be able to buy for every single U.S. household next year?
References
U.S. Census Bureau. Historical Households Tables. Table HH-1. Households by Type: 1940 to Present. [Excel Spreadsheet]. 21 November 2023. Accessed 23 January 2024.
U.S. Treasury Department. Debt to the Penny. [Online Database]. 19 January 2024. Accessed 22 January 2024. Note: As 20 January 2024 fell on a Saturday when the U.S. Treasury Department's debt window is closed, with no changes to national debt taking place, the national debt recorded for 19 Janaury 2024 is the appropriate reference for President Biden's third anniversary in office.
U.S. Treasury Department. Major Foreign Holders of Treasury Securities. [Online Data]. Accessed 23 January 2024.
U.S. Treasury Department. Monthly Treasury Statement of Receipts and Outlays of the United States Government for Fiscal Year 2024 Through December 31, 2023. [PDF Document]. 11 January 2024.
Image credit: Microsoft Bing Image Creator. Prompt: "An editorial cartoon illustrating the burden of the national debt on American households."
Labels: national debt
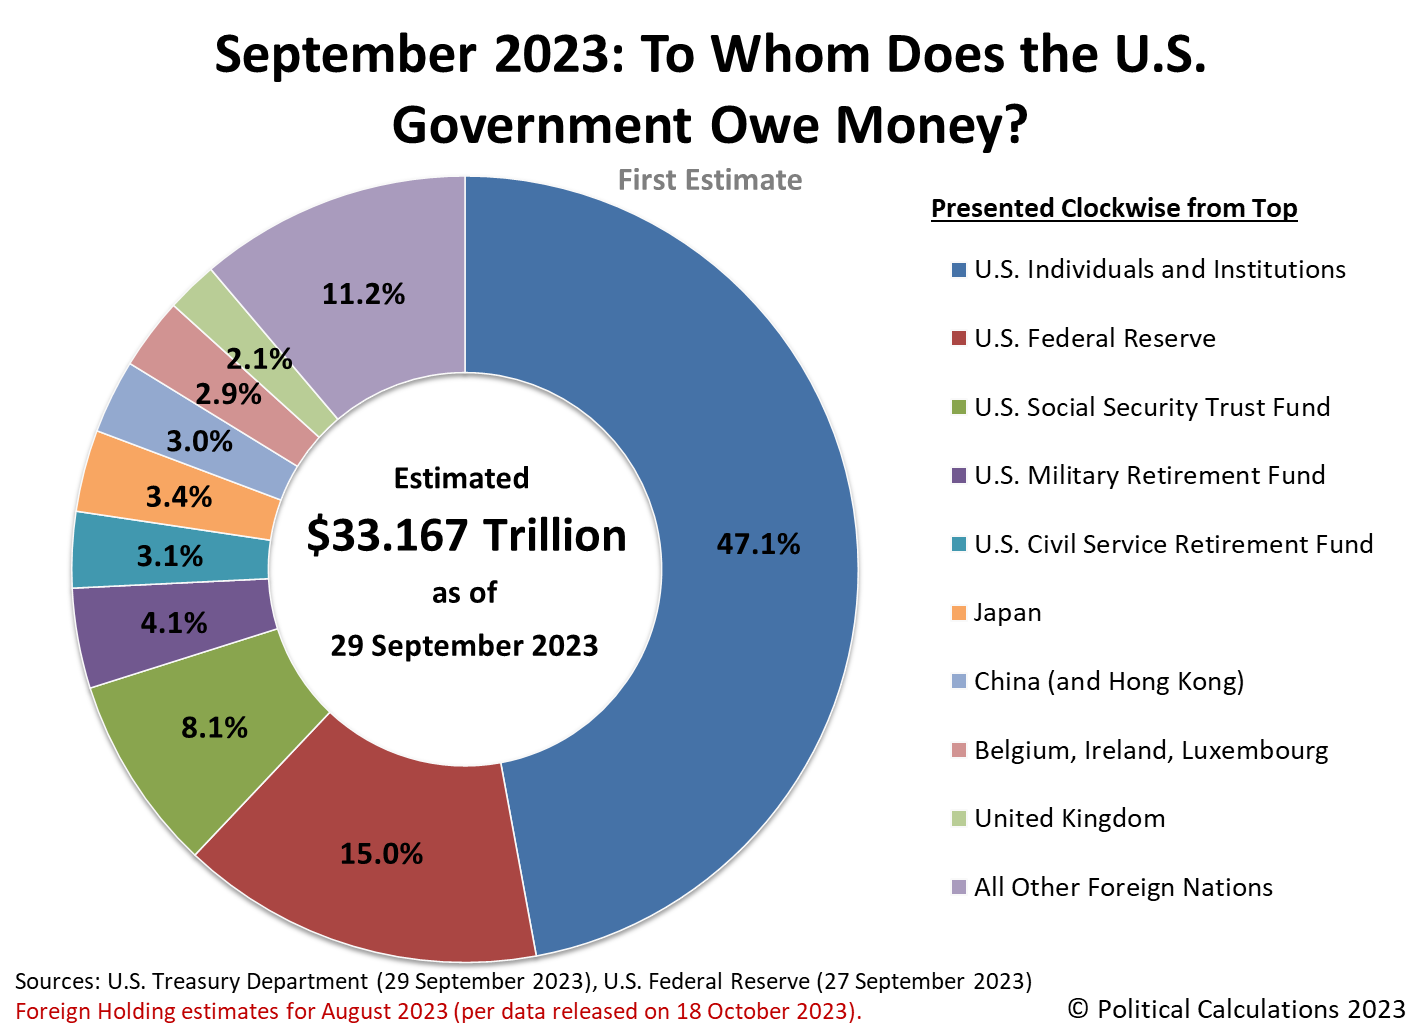
The U.S. government's total public debt outstanding through the end of its 2023 fiscal year on 29 September 2023 is nearly $33.167 trillion. The national debt increased by over $2.238 trillion since the end of the government's 2022 fiscal year.
To whom does the U.S. government owe all that money?
The following chart provides a first estimate of who the U.S. government's biggest creditors are through the end of its 2023 fiscal year along with the portion of the national debt they are owed.
The Overall Picture
Holding 15% of the total public debt outstanding, the U.S. Federal Reserve is once again the U.S. government's single largest creditor. However, its share of the national debt is down from the 18.3% it held last year as the Federal Reserve has reduced its holdings. In doing so, the Fed continued following the monetary policies it set in March 2022 when it began hiking interest rates to combat inflation unleashed by President Biden's policies.
Rising interest rates for U.S. government-issued debt securities have been attractive to U.S. individuals and institutions. Banks, insurance companies, investment funds, corporations, and individuals collectively increased their share of the national debt from 42.1% in 2022 to 47.1% in 2023.
Social Security's share of the national debt dropped from 8.9% in 2022 to 8.1% in 2023. This decline coincides with the ongoing depletion of its Old Age and Survivors Insurance trust fund because the program has been running in the red since 2009. By contrast, the combined share held by the government's military and civilian employee retirement trust funds increased from 6.3% to 7.2%.
Altogether, the portion of the U.S. national debt held by U.S. entities in 2023 is 77.4%, up from 75.7% in 2022.
That brings us to the second-most interesting year-over-year change in who owns the U.S. national debt. The amount of debt held by foreign entities was unchanged from 2022 to 2023 at $7.509 trillion.
Among the major foreign holders of U.S. government-issued debt securities, both Japan and China decreased their holdings over the 2023 fiscal year, while all other nations increased their net holdings enough to offset that decline. As for why, both Japan and China have been engaged in efforts to prevent the value of their currencies from falling too much with respect to the U.S. dollar, which has involved selling off their holdings of U.S. government-issued debt securities.
The following waterfall chart breaks down where most the money the U.S. government newly borrowed during its 2022 fiscal year came from:

So there you have it. The Federal Reserve, Social Security, Japan, and China have seen their share of the U.S. national debt fall, while pretty much everyone else increased the share they hold, with U.S. individuals and institutions increasing their share the most.
About the Data
The U.S. government's total public debt outstanding is the value recorded for 29 September 2023, the final day of the government's 2023 fiscal year, which also applies for the portion of the national debt held by the government-operated trust funds for Social Security, military and civilian government employees. Data for foreign holdings is based on estimates through August 2023 that was released on 18 October 2023. The Federal Reserve's holdings are those recorded on 27 September 2023.
Labels: national debt
Update 9 March 2023: Econbrowser's Menzie Chinn is, once again, irrationally upset. Here's what he's worked himself up about now as it applies to information that appears in this article:
According to the Treasury Department’s Bureau of the Debt (accessed on 3/8/2023), on January 20, 2023, gross federal debt was $31454980005742.4, and on January 20, 2021, it was $27751896236414.7. Using excel (so as to ensure no mistyping errors), I find the change in the two years to be $3703083769327.70, and not $3,695,343,467,324.62 (as indicated in the PoliticalCalculations blogpost he references). Since the January 20, 2023 number matches my figure, and the figure in the Treasury website, I can only conclude that he made a subtraction mistake. He also made a mistake in calculating the percentage growth rate. I obtain 13.3% (and not 11%) change. My advice – don’t trust the math in Independent Institute pieces.
We would like to thank Chinn for identifying the error. The real error we made traces back to 11 February 2021, when we incorrectly identified the U.S. government's total public debt outstanding for 20 January 2021 as $27.76 trillion. The figure we presented instead represents the total public debt outstanding from 22 January 2021 ($27,759,636,538,417.78). While the math presented in the remaining post is correct when using that figure, by omitting the first two days of President Biden's tenure in office, our analysis understates the full amount by which the nation's public debt outstanding increased by a very small percentage. Meanwhile, what he claims to be a mistake in calculating the percentage growth rate turns out to be something of a misdiagnosis on his part... keep reading to find out more!
But first, if you would like to know more about why Chinn is so irrationally upset at us, please do check out our Examples of Junk Science Series. The series features multiple examples Menzie Chinn unintentionally contributed through his self-destructive antics, including an example when he beclowned himself by failing to correctly diagnose a different error we made.
Back to the correction! Unlike Chinn, we acknowledge our errors and correct them. We've updated the following analysis to show the corrected results in (parentheses and boldface font) where you may hover your cursor over these to see the original figures we presented. We've also updated the chart accordingly (the original version is available here). As you'll see, other than the figure indicating the change in the national debt over two years, the corrections do not meaningfully affect the analysis.
You'll also see the 11% figure he quotes refers to the size of the national debt increase per household that, after the corrections, turns out to be more on the nose than we had previously presented! Chinn seems to be going back into his bag of deceptive junk science tricks in deliberately conflating the percentage change in national debt (13.3%), which we had never presented, with the percentage change in the national debt per household (10.9%, which rounds up to 11%) that we did present.
We wonder how James Hamilton feels about his co-blogger's strange sense of ethics and behavior.
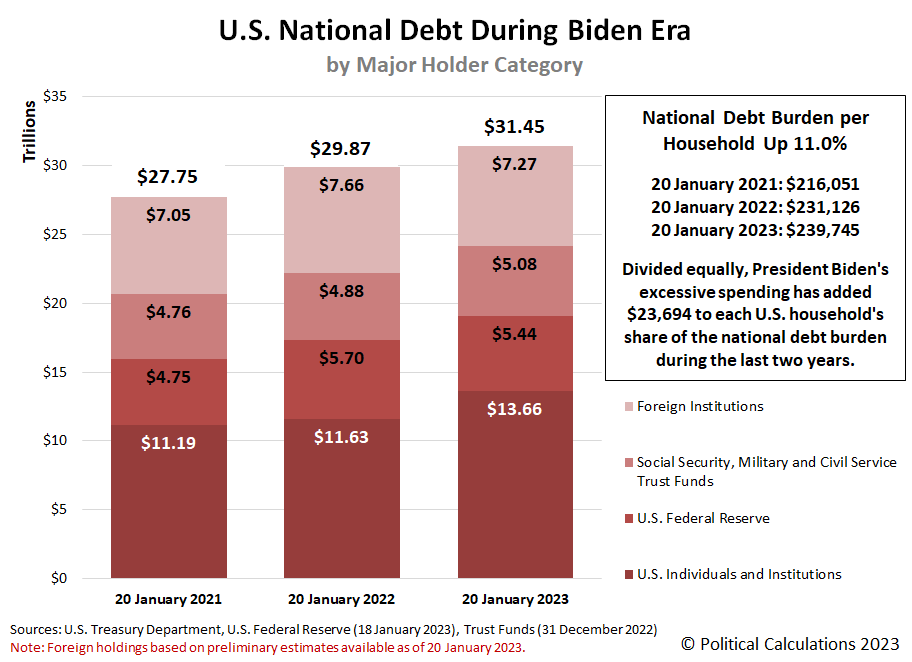
Friday, 20 January 2023 marked the second anniversary of President Biden's tenure in the White House. On that day, the U.S. government's total public debt outstanding reached $31,454,980,005,742.40. The only reason it isn't higher is because the U.S. Treasury Department hit the nation's statutory debt ceiling the day before.
But that's not the real story. The more important story is the growth of the U.S. national debt during the last two years. That debt has increased by ($3,703,083,769,327.63) since 20 January 2021.
Large numbers like that can be difficult to grasp, so let's bring them down to a more human scale. If you divided the U.S. government's total public debt outstanding equally among every household in the U.S. two years ago, each would be responsible for paying the U.S. government's creditors ($216,051). Two years later, the national debt burden per household has grown to $239,745. The increase per household is ($23,694), or (11.0%), which of course, would be on top of whatever other debt each household has.
That increase is the equivalent of buying 131,202,000 American households a brand new 2023 Suburu Impreza! More on that metaphor in a bit....
We've visualized the growth of the U.S. national debt during the Biden era in the following chart. In the chart, we've also identified the U.S. government's creditors by major category:
Here's the big question. Would American households be better off if President Biden actually did buy each a brand new Suburu Impreza instead of what he actually bought with all that newly borrowed money?
Or rather, did Americans get anything of real value to show from President Biden's debt-fueled spending and what it has wrought?
References
U.S. Census Bureau. Historical Households Tables. Table HH-1. Households by Type: 1940 to Present. [Excel Spreadsheet]. 10 November 2022. Accessed 23 January 2023.
U.S. Treasury Department. Debt to the Penny. [Online Database]. 20 January 2023. Accessed 23 January 2023.
U.S. Treasury Department. Major Foreign Holders of Treasury Securities. [Online Data Text File]. 18 January 2023. Accessed 23 January 2023.
U.S. Treasury Department. Monthly Treasury Statement of Receipts and Outlays of the United States Government for Fiscal Year 2022 Through December 31, 2022. [PDF Document]. 12 January 2023. Accessed 23 January 2023.
Labels: inflation, national debt, personal finance
Do you remember 2021? Let's take a moment for a recap. When Joe Biden was sworn in as President of the United States on 20 January 2021, the U.S. national debt stood at $27.76 trillion. Just over eight months later, at the end of the U.S. government's 2021 fiscal year, the U.S. government's total public debt outstanding had risen to $28.43 trillion.
And now, one year after that, the U.S. national debt has risen to $30.93 trillion through the end of the U.S. government's 2022 fiscal year. That's an increase of $2.5 trillion over the past year and an increase of $3.17 trillion during President Biden's tenure in office.
To whom does the U.S. government owe all that money?
The following chart illustrates who the U.S. government's biggest creditors are as of the end of the U.S. government's 2022 fiscal year along with the portion of the national debt they are owed.

The Overall Picture
The U.S. Federal Reserve is once again Uncle Sam's single largest creditor, accounting for 18.3% of the entire U.S. government's national debt. The Fed's share of the total public debt outstanding has decreased from 19.1% a year ago, mainly as the Federal Reserve has all but stopped underwriting the U.S. government's new spending. Instead, since March 2022, the Federal Reserve has been hiking interest rates in a campaign to slow the rise of inflation that was unleashed by President Biden's spending.
With the Fed having raised interest rates above the near-zero level they were at when President Biden was sworn into office, U.S. individuals and institutions (banks, insurance companies, pension funds, etc.) have picked up most of the slack now that loaning money to Uncle Sam has become more worthwhile with higher interest rates. The share owned by this category of major national debt holders has increased from 37.7% to 42.1%.
Meanwhile, the share of the U.S. government's national debt owed to Social Security has continued falling from 9.2% to 8.9%. That's because Social Security has been running in the red since 2009, forcing its Old Age and Survivors' Insurance Trust Fund to sell off U.S. treasuries it accumulated when it was operating in the black so it can keep paying out benefits at promised levels. Social Security's share of the U.S. national debt is projected to decline to 0% in 2034. After that happens, Social Security benefits will be reduced by somewhere between 20-25% as promised under current law.
The retirement trust funds for the U.S. government's military and civilian employees together account for 6.6% of the total U.S. national debt, down from 7.1% in 2021.
Foreign entities collectively hold 24.3% of the total debt liabilities issued by the U.S. government, down from the share of 26.6% they held at the end of the U.S. government's 2021 fiscal year. Of the portion of the national debt owed to foreign-based institutions, Japan continues to hold the greatest share at 3.9% of the U.S. national debt based on preliminary estimates, down from its 2021 share of 4.6%. China comes in second holding a share of 3.8%, falling from a share of 4.6% in 2021. Both countries have been selling off their holdings of U.S. government-issued debt securities to keep their currencies from losing too much value with respect to the U.S. dollar.
The international banking centers of Belgium, Ireland, and Luxembourg saw their share of the U.S. government's total public debt outstanding dip from 3.0% to 2.8%, while the United Kingdom saw its share slightly rise from 2.0% to 2.1%. Brazil and the remaining foreign nations saw their shares of the U.S. national debt dip year over year.
The following waterfall chart breaks down where most the money the U.S. government newly borrowed during its 2022 fiscal year came from:

About the Data
These figures represent the most current information available as of 18 October 2022, which for the total public debt outstanding is fully current through 30 September 2022. The Federal Reserve's holdings is current through 28 September 2022, data on U.S. government entity holdings is current through September 2022, and data for foreign holdings is based on estimates through August 2022 that were released on 18 October 2022.
Labels: national debt
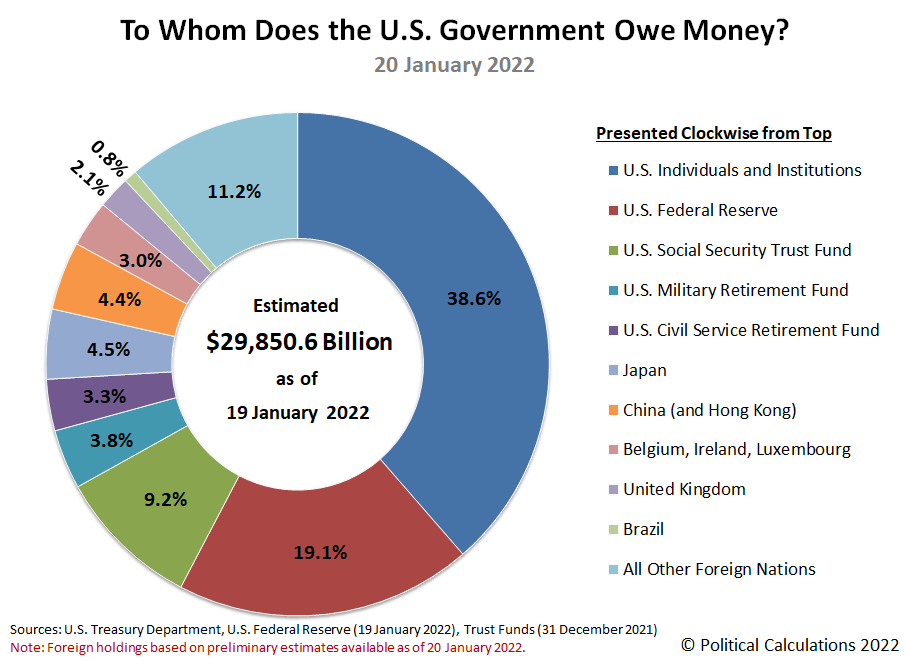
When Joe Biden was sworn in as President of the United States on 20 January 2021, the U.S. national debt stood at $27.76 trillion. One year later, the total public debt outstanding of the U.S. government has ballooned by nearly $2.11 trillion (or 7.6%) to $29.87 trillion.
Perhaps a better question to ask is to whom does the U.S. government borrow owe all the money it has borrowed?
The following chart illustrates who the U.S. government's biggest creditors are as of the end of President Biden's first year in office along with the portion of the national debt they are owed.
The Overall Picture
The U.S. Federal Reserve is once again Uncle Sam's single largest creditor, accounting for 19.1% of the entire U.S. government's national debt. The Fed's share of the total public debt outstanding has grown from 16.5% a year earlier.
By contrast, the U.S. government's second largest creditor is Social Security, whose share of the ownership of the national debt dropped from 10.4% of the total to 9.2%. Social Security has been running in the red since 2009, forcing its Old Age and Survivors' Insurance Trust Fund to sell off U.S. treasuries it accumulated when it was operating in the black in order to keep paying out benefits at promised levels. Social Security's share of the U.S. national debt is projected to decline to 0% in 2034. After that happens, Social Security benefits will be reduced by somewhere between 20-25% as promised under current law.
The retirement trust funds for the U.S. government's military and civilian employees together account for 7.1% of the total U.S. national debt. After these large holdings, a diverse range of U.S. institutions, such as banks, insurance companies, independent corporations, investment firms and individuals combine to hold the largest share of money owed by the U.S. government, accounting for 38.6% of the total, down from the 40.4% share they held a year ago.
Foreign entities combine to account for holding 25.9% of the total debt liabilities issued by the U.S. government, up from the share of 25.4% they held on 20 January 2021. Of the portion of the national debt owed to foreign-based institutions, Japan now holds the greatest share at 4.5% of the U.S. national debt based on preliminary estimates, whose share is unchanged from a year earlier. China comes in second holding a share of 4.4%, which is down from 4.6% in 2021.
The international banking centers of Belgium, Ireland, and Luxembourg saw their share of the U.S. government's total public debt outstanding held steady at 3.0%, while the United Kingdom saw its share increase from 1.5% to 2.1% over the past year. Brazil and the remaining foreign nations saw their shares of the U.S. national debt dip.
President Biden's First Year in Office
As we noted, the national debt increased by $2.11 trillion in President Biden's first year in office. That amount was inflated by President Biden's American Rescue Plan Act, which we estimate accounts for $1.34 trillion or 63.5% of the increase by itself.
The following waterfall chart breaks down where most the money the U.S. government newly borrowed in President Biden's first year in office came from:

We find the Federal Reserve loaned Uncle Sam 45% of all the net new borrowing. Foreign entities loaned the U.S. government the second largest amount at 33% of the net change, while U.S. individuals and institutions contributed the remaining 22%.
About the Data
These figures represent the most current information available as of 20 January 2022, which for the total public debt outstanding is fully current through 20 January 2022. The Federal Reserve's holdings is current through 19 January 2022, data on U.S. government entity holdings is current through December 2021, and data for foreign holdings is based on estimates through November 2021 that were published on 18 January 2022.
Labels: data visualization, national debt
When Joe Biden was sworn in as President of the United States on 20 January 2021, the U.S. national debt had reached $27.8 trillion. Through the end of the U.S. government's fiscal year on 30 September 2021, the total public debt outstanding increased to $28.4 trillion.
The following chart identifies the entities who have loaned the most money to the U.S. government. The percentage shown for each indicates how big each entity's share of the U.S. national debt is as of 30 September 2021.

The values for foreign nations shown on the chart represent a first estimate because the U.S. Treasury Department's data for the amount of U.S. government-issued debt held by foreign entities only reflects its estimates through August 2021. Data through September 2021 will become available next month, which will be subject to revision before being finalized sometime in 2022.
Once again, the U.S. Federal Reserve is Uncle Sam's largest single entity creditor, outranking its former top creditor, Social Security's Old Age and Survivors Insurance Trust Fund, by a widening margin. That margin is widening because Social Security is running in the red, which means it has to cash in its holdings of U.S. Treasuries to keep paying benefits to Social Security beneficiaries at promised levels.
But what is really remarkable is the extent to which the U.S. Federal Reserve is funding the U.S. government's spending above and beyond what it collects in taxes that has taken place during Joe Biden's tenure in office. Since 20 January 2021, the U.S. national debt has increased by $669.3 billion, but the U.S. Federal Reserve's holdings of U.S. government-issued debt securities has increased by $687.5 billion.
That's possible because the U.S. Federal Reserve has more than offset a net reduction of $520.4 billion in the amount of money other U.S. entities have loaned to the U.S. government during this time. At the same time, foreign entities have boosted the amount of money they've loaned to the U.S. government by $502.2 billion, which when combined with the other figures, accounts for the overall net change since 20 January 2021. Here's a visual rundown of the net national debt change math as presented using a waterfall chart:

As of the end of the U.S. government's 2021 fiscal year, the Federal Reserve had loaned nearly one out of every five dollars the U.S. government owed through the end of September 2021.
About the Data
These figures represent the most current information available as of 30 September 2021, which for the total public debt outstanding and data on U.S. government entity holdings is current through that date. The Federal Reserve's holdings is fully current through 29 September 2021. Data for foreign holdings is based on estimates through August 2020 that were published on 18 October 2021.
Labels: data visualization, national debt
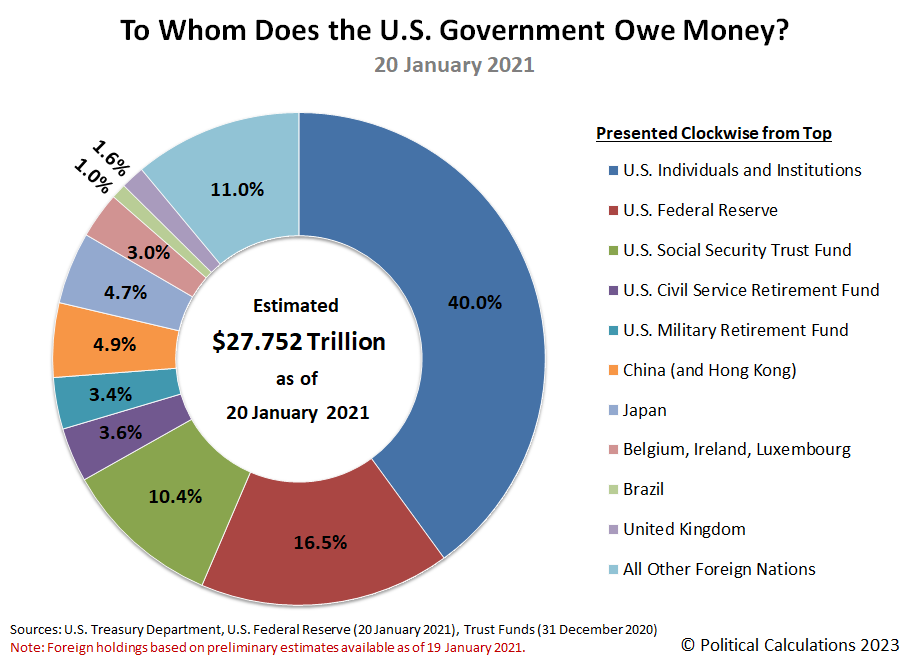
As Joe Biden was sworn in as President of the United States on 20 January 2021, the U.S. national debt reached $27.76 trillion. To whom did the U.S. government owe all that money on that date?
The following chart reveals the major lenders who have fed the U.S. government's spending appetites up through President Biden's inauguration day and shows the estimated share of the U.S. government's total public debt outstanding owed to each.
Update 9 March 2023: This chart has been corrected! We had erroneously copied the total public debt outstanding from 22 January 2021 instead of from 20 January 2021. The original version of the chart is available here.]
The U.S. Federal Reserve is Uncle Sam's largest single entity creditor, having overtaken the Social Security Old Age and Survivors Insurance Trust Fund operated by the U.S. government by a wide margin. The U.S. government owes one out of every six dollars of the U.S. national debt to the U.S.' central bank, which is overseen by an agency of the federal government.
Two other trust funds operated by the U.S. government account loaned a combined 7% of the U.S. national debt. The U.S. Civil Service Retirement Fund and the U.S. Military Retirement Fund have respectively lent 3.6% and 3.4% of the U.S. national debt to the federal government.
A diverse range of U.S. institutions, such as banks, insurance companies, independent corporations, investment firms and individuals combine to hold the largest share of money owed by the U.S. government, accounting for 40% of the total.
Foreign entities hold 25.4% of the total debt liabilities issued by the U.S. government. Of the portion of the national debt owed to foreign-based institutions, China (with Hong Kong) holds the greatest share at 4.9% of the U.S. national debt. Japan comes in second with 4.7%, followed by the international banking centers of Belgium, Ireland, and Luxembourg with a combined 3.0%. The United Kingdom holds 1.6%, while Brazil is owed 1.0% of the U.S. national debt. All the remaining nations of the world combine to hold 11.0%.
About the Data
These figures represent the most current information available as of 20 January 2021, which for the total public debt outstanding and the Federal Reserve's holdings is fully current through 20 January 2021, data on U.S. government entity holdings is current through December 2020, and data for foreign holdings is based on estimates through November 2020 that were published on 19 January 2021.
Labels: data visualization, national debt
As of the end of its 2020 fiscal year on 30 September 2020, U.S. government's total public debt outstanding stood at $27,026,921,935,432.41 ($27.027 trillion). One year earlier, it stood at $22,622,684,674,364.43 ($22.623 trillion). During the year in between, the total U.S. national debt rose by $4.404 trillion.
Earlier this year, we found the U.S. Federal Reserve had become the U.S. government's new sugar daddy. As of 30 September 2020, we find that the Federal Reserve directly holds over $4.445 trillion in U.S. Treasury securities, up $2.338 trillion from the $2.108 trillion it held a year earlier. Uncle Sam's new friendly neighborhood loan shark lent 47% of all the dollars the government borrowed during its 2020 fiscal year.
As a result, the Fed's share of all the money borrowed by the U.S. government increased from 1 out of every 8 dollars the government has borrowed to 1 out of every 6 dollars. If we just focused on the publicly-held portion of the national debt, the Fed's share would increase to 1 out of every 5 dollars borrowed.
In becoming the U.S. government's primary creditor, the Fed has widened its margin over Uncle Sam's former top lender, Social Security's Old Age and Survivors Insurance Trust Fund, which has only loaned the U.S. government 1 out every 10 dollars it has borrowed.
The following chart tallies the shares of money the U.S. government has borrowed from its major worldwide creditors. Please click here to access the full size version of the chart.

With the Fed having taken such a dominant lender role in financing the U.S. government's spending, the relative share of money borrowed from foreign entities has decreased. That share has fallen from 30% of the total public debt outstanding in 2019 to 26% in 2020. Japan has become the largest foreign creditor to the U.S. government, as China seeks to reduce its holdings of U.S. government-issued debt.
We had to wait until the U.S. Treasury Department issued its September 2020 monthly treasury statement some four days late on 16 October 2020 to get the latest debt holdings for Social Security and other trust funds operated by the U.S. government. The data for major foreign holders of U.S. government-issued debt is preliminary (or rather, only up-to-date through August 2020) and will be subject to revision over many months ahead.
Labels: national debt

The U.S. government has gone on a borrowing binge since the global coronavirus pandemic reached the nation's shores and the number of known cases began increasing relentlessly at the end of February 2020, just over two months ago. From 26 February 2020 through 29 April 2020, the U.S. government's total public debt outstanding has increased by $1.427 trillion, from $23.427 trillion to $24.854 trillion.
That's a lot of money to borrow, and for all practical purposes, all of it was loaned to the U.S. government by its new Number One creditor, the U.S. Federal Reserve, to whom the U.S. government now owes more money than it does to its previous largest single creditor, Social Security. According to the Federal Reserve's H.4.1 statistical release for 29 April 2020, the Fed holds $3.945 trillion worth of U.S. Treasury securities, up from $2.465 trillion back on 26 February 2020, shortly before the number of known coronavirus cases in the U.S. began their rapid rise, which triggered the government actions that crashed the economy.
Our sharp eyed readers who do the math will catch that the Federal Reserve's holdings of U.S. government-issued debt securities increased by $1.480 trillion, more than the amount by which the federal government's total public debt outstanding increased over the same period of time.
How is that possible? Under current law, the Federal Reserve is prohibited from directly loaning money to the U.S. government, so it is actually acquiring debt securities that were originally issued by the U.S. Treasury when it borrowed money from banks and other financial institutions. The Federal Reserve can then pay them for their holdings of U.S. treasuries through its open market operations, much like how the lender you might have originally gotten your mortgage through might sell it to another financial institution. The money that was borrowed is still owed under the same terms as before, but now it's paid back to a different entity.
Doing that gives the original creditor more money to be able to go out and loan even more money to the U.S. government, which in the current environment, the Fed will then pay to acquire it from them. That process will repeat until the Fed decides it has had enough and tries to stop. Like it has before, which didn't really work out all that well for it.
In any case, that's how the Fed went from holding less than one in ten of all the dollars the U.S. government has borrowed to about one in six, making it the new single largest creditor to Uncle Sam.
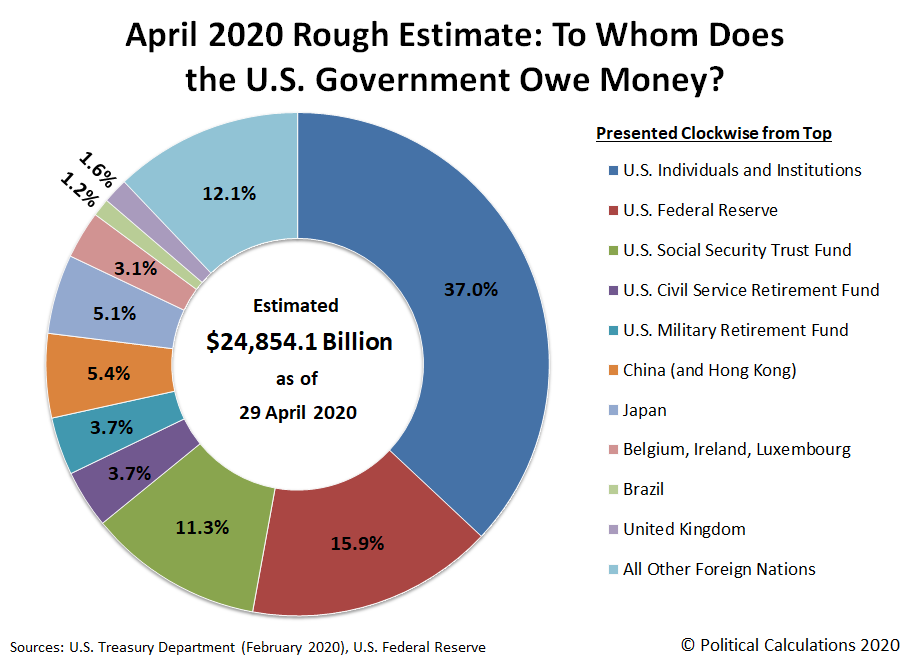
So to answer the question of how the Fed's holdings of U.S. treasuries is increasing faster than the rate at which the U.S. government is borrowing money, it's because the Fed's holdings are being tapped out of the larger pool of treasuries held by U.S. individuals and institutions, which is then quickly replenished.
We're calling this a rough estimate because not all the data in the chart is synced together. The data for the amount of debt held by the U.S. government's major foreign creditors is preliminary and is only current through February 2020, while data for Social Security and the civil and military retirement trust funds is from March 2020. It's as close as we can estimate with the data that's available.
How do you suppose the Fed will want to be paid back? And where do you suppose the U.S. government will get the cash to do that?
Image credit: Hello I'm Nik 🎞
Labels: national debt
Who loans money to the U.S. government?
We've developed the following chart to answer that question, which is a companion to the 'donut' national debt ownership chart we've featured in the latest update to our "To Whom Does the U.S. Government Owe Money?" series.

For this chart, we've used a bar chart format to present the actual amounts owed to the U.S. government's major creditors, where we've also simplified the foreign-held portion of the data by splitting it up according to the type of creditor rather than by country.
In doing that, we find that private institutions (such as banks, insurance companies, mutual funds, etc.) and individuals make up the single largest category of lenders to the U.S. government with a combined total of $9,053 billion owed to U.S. and foreign holders of U.S. government-issued debt securities, such as Treasury bonds, short term debt, and federal agency bonds. Combined, these lenders own 42% of the $21,516 billion U.S. national debt recorded at the end of September 2018.
The second largest category is central banks, which for the U.S. means the Federal Reserve, and for the foreign category, refers to "foreign official" institutions. Together, the world's central banks account for $6,708 billion of all money owed by the U.S. government to its creditors, or 31% of the total public debt outstanding, with the Federal Reserve accounting for 12.5% of that amount.
The remaining categories we've broken out are covered by the U.S. government's "intragovernmental holdings" of the U.S. national debt, which includes the trust funds for Social Security and for Federal Hospital Insurance, as well as federal government operated pension funds for its civil service and military employees. These make up the "Big 4" holders of the U.S. national debt within the U.S. government, and with all other U.S. government holdings as of the end of the 2018 fiscal year, add up to $5,755 billion.
This latter category has begun to shrink because Social Security is now running an operating deficit, taking in less money than it spends, which means it has to cash in the U.S. debt securities it holds to make up the difference for paying out retirement pension benefits at promised levels to retired Americans.
References
U.S. Department of the Treasury. Treasury International Capital (TIC) System. Securities (B): Portfolio Holdings of U.S. and Foreign Securities. [Data Resources]. Accessed 27 August 2019.
U.S. Department of the Treasury. Treasury International Capital (TIC) System. Monthly Holdings of U.S. Long-term Securities at Current Market Value by Foreign Residents. [CSV Data]. June 2019.
U.S. Department of the Treasury. Debt to the Penny. [Online Application]. 28 September 2018.
U.S. Department of the Treasury. Treasury International Capital (TIC) System. Historical Liabilities to Foreigners by Type and Holder. Short-term securities. Historical Data. [CSV Data]. June 2019.
U.S. Department of the Treasury. Final Monthly Treasury Statement of Receipts and Outlays of the United States Government for Fiscal Year 2018 Through September 30, 2018, and Other Periods. [PDF Document]. 12 October 2019.
Labels: data visualization, national debt
Welcome to the blogosphere's toolchest! Here, unlike other blogs dedicated to analyzing current events, we create easy-to-use, simple tools to do the math related to them so you can get in on the action too! If you would like to learn more about these tools, or if you would like to contribute ideas to develop for this blog, please e-mail us at:
ironman at politicalcalculations
Thanks in advance!
Closing values for previous trading day.
This site is primarily powered by:

CSS Validation

RSS Site Feed

JavaScript
The tools on this site are built using JavaScript. If you would like to learn more, one of the best free resources on the web is available at W3Schools.com.
Other Cool Resources
Blog Roll


